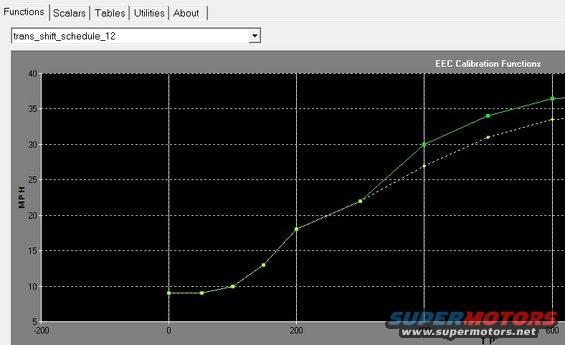
A graph displays EEC calibration functions with MPH on the y-axis and TP on the x-axis.
Comments
More from this build
A graph displays EEC calibration functions with MPH on the y-axis and TP on the x-axis.

No comments yet.