Home/
Registry/
Hyundai/
Genesis Coupe/
2010-2016/
“Coupe”/
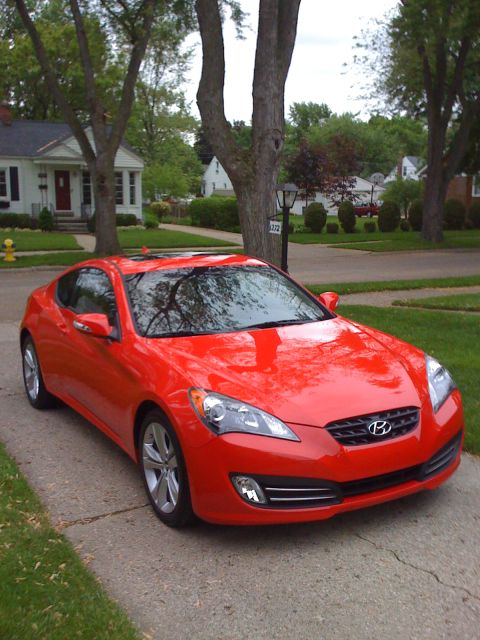
Photo
supermotors.net/registry/media/1074731
Graph of specific heat capacity vs. % antifreeze by volume

This is a graph showing the specific heat capacity of a water/antifreeze mixture as a function of the percentage of antifreeze by volume. The x-axis represents the percentage of antifreeze by volume, ranging from 0% to 100%. The y-axis represents the specific heat capacity (Cp) in BTU/(lb°F), ranging from 0.5 to 1.0.
Is this accurate? Sign in to help verify it.
Comments
More from this build
No comments yet.