Pontiac Fiero GT Dyno Sheet 2004 - 197 HP / 496 ft-lb Dynolabs Results
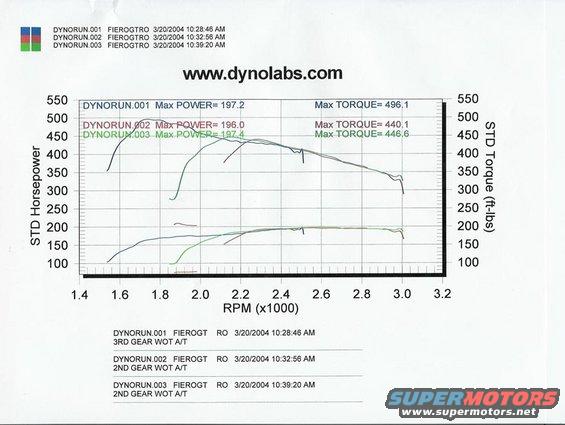
Chassis dyno graph (dynolabs.com) overlaying three WOT pulls; peak STD power 197.2 hp and peak STD torque 496.1 ft-lbs vs RPM x1000.
This document is a chassis dynamometer results sheet (dyno graph) from www.dynolabs.com, dated 3/20/2004, for a vehicle identified as "FIEROGT" / "FIEROGTRO", consistent with a Pontiac Fiero GT. Three wide-open-throttle (WOT) dyno runs are plotted, showing STD Horsepower and STD Torque (ft-lbs) versus engine speed from roughly 1,400 to 3,200 RPM (axis labeled RPM x1000). Run 1 (DYNORUN.001, 10:28:46 AM, 3rd gear WOT with automatic transmission) recorded a maximum power of 197.2 hp and maximum torque of 496.1 ft-lbs. Run 2 (DYNORUN.002, 10:32:56 AM, 2nd gear WOT A/T) produced 196.0 hp max and 440.1 ft-lbs max torque. Run 3 (DYNORUN.003, 10:39:20 AM, 2nd gear WOT A/T) produced 197.4 hp max and 446.6 ft-lbs max torque. The graph shows torque curves peaking near 1,700-1,800 RPM at 450-500 ft-lbs and horsepower plateauing around 195-200 hp between roughly 2,300 and 3,000 RPM. A reader can learn the peak power/torque figures, run conditions (gear, throttle, transmission type), test times, and the overall shape of the power and torque curves for this modified Fiero.
Is this accurate? Sign in to help verify it.
Frequently asked questions
- What was the maximum horsepower recorded on this dyno sheet?
- The highest peak was 197.4 hp on DYNORUN.003; DYNORUN.001 made 197.2 hp and DYNORUN.002 made 196.0 hp.
- What was the peak torque measured?
- DYNORUN.001 recorded the highest maximum torque of 496.1 ft-lbs; runs 2 and 3 recorded 440.1 and 446.6 ft-lbs respectively.
- Under what conditions were the dyno runs performed?
- All runs were wide-open throttle (WOT) with an automatic transmission (A/T): DYNORUN.001 in 3rd gear, and DYNORUN.002 and DYNORUN.003 in 2nd gear.
- When were the dyno runs performed?
- All three runs were done on 3/20/2004: at 10:28:46 AM, 10:32:56 AM, and 10:39:20 AM.
- What RPM range does the dyno graph cover?
- The graph plots STD Horsepower and STD Torque from approximately 1,400 to 3,200 RPM (x-axis labeled RPM x1000, 1.4 to 3.2).
Comments
More from this build





No comments yet.