Torque Dyno Chart: PowerPack vs Stock vs Test Vehicle (1400-3000 RPM)
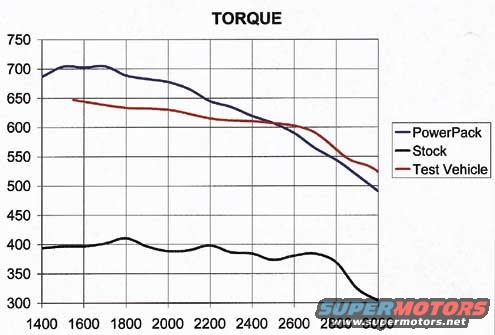
Torque-vs-RPM dyno graph comparing three states (PowerPack up to ~700 lb-ft, Stock ~400 lb-ft, Test Vehicle ~650 lb-ft) across 1400-2800 RPM.
Part of 1994-2002 Dodge 2500 Data & Spec Plates
This document is a dynamometer-style torque comparison graph titled "TORQUE." It plots torque (vertical axis, ranging from 300 to 750, presumably lb-ft) against engine speed (horizontal axis, 1400 to 3000 RPM) for three configurations identified in the legend: "PowerPack" (blue), "Stock" (black), and "Test Vehicle" (red). The PowerPack curve is the highest, peaking around 700-705 near 1600-1700 RPM and tapering to roughly 490 at 3000 RPM. The Test Vehicle curve begins around 645 near 1550 RPM and gradually declines to about 525 at 3000 RPM, crossing below or converging with the PowerPack line in the upper RPM range around 2500-2600 RPM. The Stock curve is dramatically lower, hovering between roughly 370 and 410 across most of the range and falling to about 310 at 3000 RPM. A reader can learn that the PowerPack and Test Vehicle modifications produce roughly 200-300 lb-ft more torque than the stock configuration across the entire measured RPM band. The chart carries no vehicle identification, date, part numbers, or test conditions; it was uploaded to a 2001 Dodge 2500 gallery, suggesting it likely relates to Cummins diesel performance upgrades, but nothing on the graph itself states this.
Is this accurate? Sign in to help verify it.
Frequently asked questions
- What does the PowerPack torque curve peak at?
- The PowerPack curve peaks at approximately 700-705 (presumably lb-ft) around 1600-1700 RPM, the highest of the three curves shown.
- How much more torque does the PowerPack make compared to Stock?
- Across the graph, the PowerPack curve runs roughly 200-300 units above the Stock curve; e.g., near 1600 RPM PowerPack shows ~700 while Stock shows ~400.
- What RPM range does the chart cover?
- The horizontal axis runs from 1400 to 3000 RPM in 200 RPM increments.
- How does the Test Vehicle compare to the PowerPack?
- The Test Vehicle (red) starts lower (~645 vs ~700) but declines more gradually; the two curves converge around 2500-2600 RPM, after which the Test Vehicle reads higher (~525 vs ~490 at 3000 RPM).
- What is the Stock torque at 3000 RPM?
- The Stock curve falls to approximately 310 at 3000 RPM.
Comments
More from this build
No comments yet.