Dodge SRT-4 Stage 3 Dyno Sheet - 358.7 HP / 412.9 lb-ft Dynapack Results 2007

Dynapack chassis dyno graph (4WD, SAE correction) plotting flywheel torque and power vs RPM: peak 358.2 lb-ft at 4398 rpm and 337.9 hp at 5851 rpm.
This document is a chassis dynamometer results sheet produced on a Dynapack chassis dynamometer at Xact Dyno in Tempe, Arizona, dated 26-Apr-2007. The header reads "RHAS-SP V1.3-03E (4WD - Motor Vehicle 2000+4000) - Xact Dyno," and the Run ID is "KOVACH STG3 SRT4-2" filed under folder "UMS." Two graphs plot flywheel torque (lbft) and flywheel power (Hp) against engine RPM from 1775 to 6000 RPM, both SAE-corrected, with multiple overlaid runs shown in yellow, light blue, and dark blue traces. The results tables report a peak torque of 412.9 lbft at 4413 RPM / 90 mph (green run) versus 358.2 lbft at 4398 RPM (yellow run), a torque gain of 54.6 lbft. Peak power is 358.7 Hp at 4727 RPM / 96 mph (green run) versus 337.9 Hp at 5851 RPM / 119 mph (yellow run), a power gain of 20.9 Hp. Both tables list a drive ratio of 3.448 and a tcf of 1.00. The sheet lets a reader compare baseline and modified (Stage 3) power/torque curves and identify where in the RPM band peak output occurs.
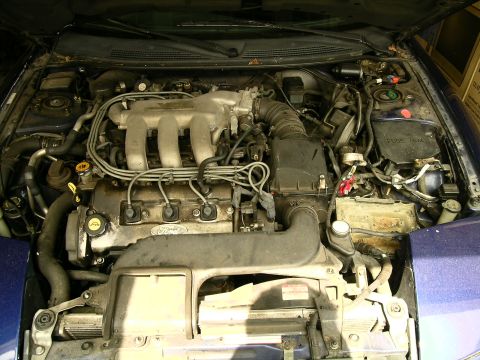
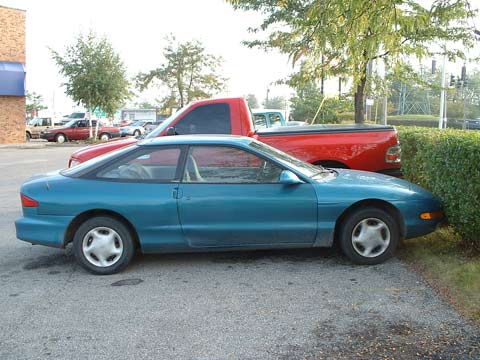
This document covers 2007, which may differ from this 1996 Ford Probe.
Is this accurate? Sign in to help verify it.
Frequently asked questions
- What peak horsepower is shown on this dyno sheet?
- The peak flywheel power shown is 358.7 Hp at 4727 RPM and 96 mph (green run); the yellow run shows 337.9 Hp at 5851 RPM.
- What peak torque is recorded?
- 412.9 lbft at 4413 RPM / 90 mph on the green run, compared to 358.2 lbft at 4398 RPM on the yellow run — a gain of 54.6 lbft.
- What dyno and correction method were used?
- A Dynapack chassis dynamometer at Xact Dyno (Tempe, Arizona), with flywheel torque and power corrected using the SAE method (UMS, tcf 1.00).
- When was this dyno run performed and what is the Run ID?
- The run is dated 26-Apr-2007 at 12:10:42, Run ID "KOVACH STG3 SRT4-2", folder "UMS".
- What drive ratio is listed on the sheet?
- Both the torque and power result tables list a ratio of 3.448 and a tcf (transmission correction factor) of 1.00.
Comments
More from this build


No comments yet.