Home/
Registry/
Mercury/
Grand Marquis/
1982-1991/
“BIGNSLOW”/
Photo
supermotors.net/registry/media/871677
DaSilva Racing Dynojet Dyno Sheet - 356.66 hp / 379.86 ft-lbs (6/2/2011)

Reference · 1982-1991 Grand MarquisAll 3 data & spec plates
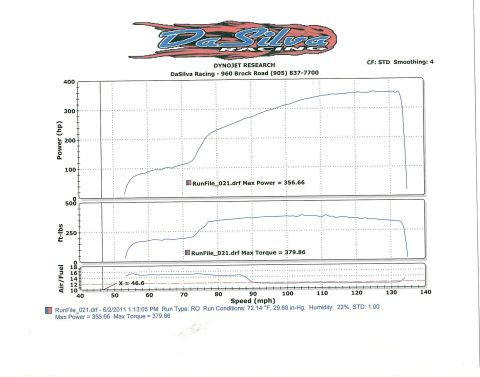
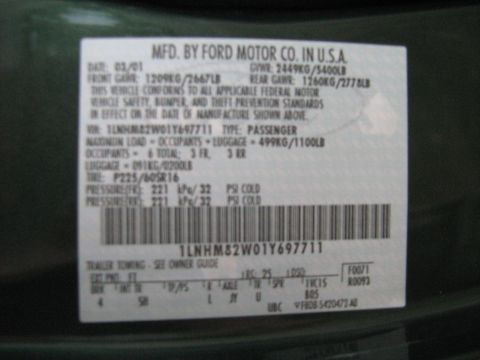
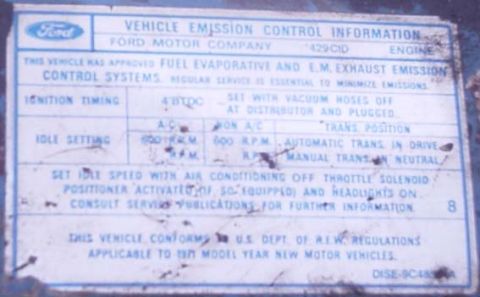
Dynojet power graph (DaSilva Racing) showing max power 356.66 hp and max torque 379.86 ft-lbs vs speed, with air/fuel trace; run conditions 72.14F, 29.88 in-Hg, 22% humidity.
Part of 1982-1991 Mercury Grand Marquis Data & Spec Plates
This document is a chassis dynamometer (dyno) results sheet produced on Dynojet Research equipment at DaSilva Racing, 960 Brock Road, phone (905) 837-7700. It presents three stacked graphs plotted against vehicle speed (40-140 mph): rear-wheel power (hp, 0-400 scale), torque (ft-lbs, 0-500 scale), and air/fuel ratio (10-18 scale). The run file is RunFile_021.drf, recorded 6/2/2011 at 1:13:05 PM, run type RO. Recorded peak values are Max Power = 356.66 hp and Max Torque = 379.86 ft-lbs. Run conditions were 72.14 °F, 29.88 in-Hg barometric pressure, 22% humidity, with a standard correction factor (CF: STD, STD: 1.00) and smoothing set to 4. The air/fuel trace shows a cursor annotation "X = 46.6" and the mixture running around 15-16:1 at lower speeds, richening to roughly 12-13:1 above about 90 mph. Power climbs steadily to a plateau near 356 hp around 120-130 mph before dropping at the end of the run. The sheet does not identify the vehicle, engine, or gear used; it was uploaded to a 1985 Mercury Grand Marquis gallery but contains no vehicle-specific identification.
Is this accurate? Sign in to help verify it.
Frequently asked questions
- What peak power and torque are shown on this dyno sheet?
- Max Power = 356.66 hp and Max Torque = 379.86 ft-lbs, from RunFile_021.drf.
- What were the run conditions during this dyno test?
- 72.14 °F, 29.88 in-Hg barometric pressure, 22% humidity, with STD correction factor of 1.00 and smoothing set to 4.
- Where and when was this dyno run performed?
- At DaSilva Racing, 960 Brock Road (905) 837-7700, on 6/2/2011 at 1:13:05 PM, using Dynojet Research equipment.
- What does the air/fuel graph show?
- The air/fuel ratio runs roughly 15-16:1 at lower speeds and drops to about 12-13:1 above roughly 90 mph, with a cursor annotation of X = 46.6.
- Over what speed range was the run plotted?
- The graphs are plotted against speed from 40 to 140 mph, with the actual run data spanning roughly the low 50s to about 135 mph.


No comments yet.