Home/
Registry/
Ford/
Fairlane/
1968-1969/
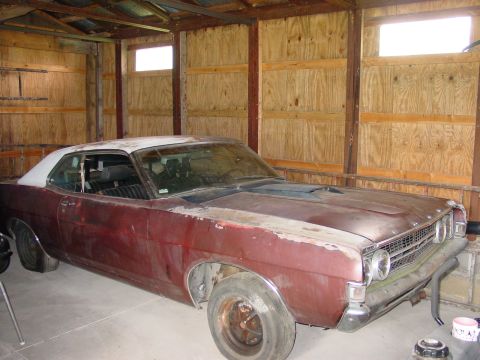
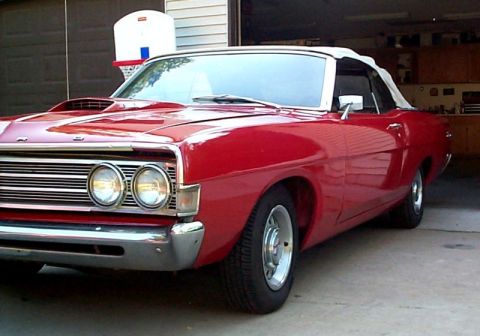
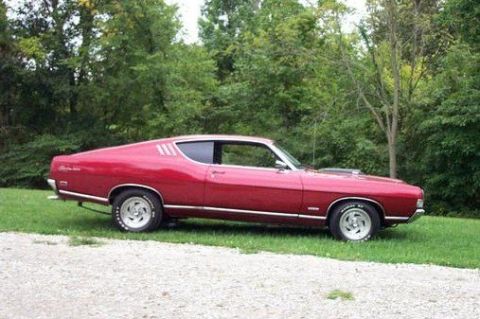
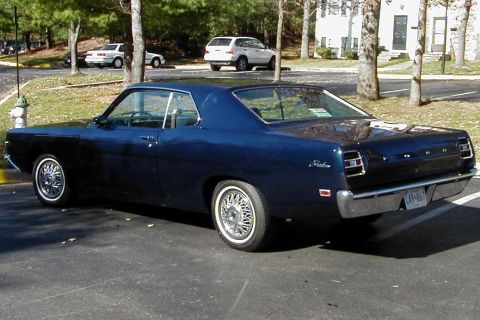
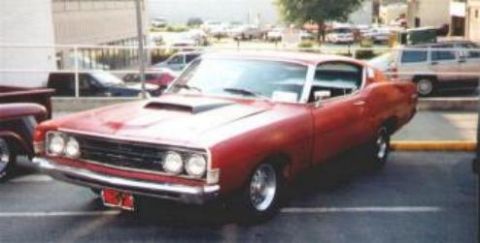
1969 Ford Fairlane/
Photo
supermotors.net/registry/media/198514
Von Mises Stress FEA Plot - CapSaddle5 Modal Analysis Mode 7 Result Window

Reference · 1968-1969 FairlaneAll 22 schematics


Finite-element von Mises stress analysis screenshot showing color-coded stress contours on a deformed cast saddle part.
Part of 1968-1969 Ford Fairlane Schematics
This document is a screenshot of a finite element analysis (FEA) result window, not a traditional automotive schematic. It displays a von Mises stress (Maximum) contour plot with averaged values on a deformed original model of a part identified as "CapSaddle5_Modal" under "Analysis1" in a window labeled "window1". The analysis is a modal analysis showing Mode 7 at a frequency/eigenvalue of +1.3937E+03, with a maximum displacement of +1.0000E+00 and a display scale of 1.0760E+00. A color legend on the right maps stress values ranging from a minimum of 1.018e+04 to a maximum of 2.659e+07 (units not stated, likely Pa based on convention). The 3D mesh model resembles a bearing cap or saddle-type component (such as a main bearing cap or crankshaft saddle casting) with multiple cylindrical bosses shown in blue (low stress) and localized red/orange high-stress regions along ribs and fillets. An X-Y-Z coordinate triad appears in the lower left. A reader can learn the stress distribution pattern and stress magnitude range for this component in its seventh vibration mode.
Is this accurate? Sign in to help verify it.
Frequently asked questions
- What type of analysis result is shown in this image?
- A von Mises stress (Maximum) contour plot with averaged values displayed on a deformed original model, from a modal analysis (Mode 7).
- What is the maximum and minimum stress shown on the legend?
- The legend ranges from a maximum of 2.659e+07 down to a minimum of 1.018e+04 (units not stated in the image).
- What mode and value is displayed?
- Mode 7, with a value of +1.3937E+03, a Max Disp of +1.0000E+00, and a display Scale of 1.0760E+00.
- What model and analysis are referenced?
- The window footer reads "window1" - CapSaddle5_Modal - Analysis1, indicating the model is named CapSaddle5_Modal under Analysis1.
No comments yet.