Home/
Registry/
Ford/
Mustang/
1964-1973/
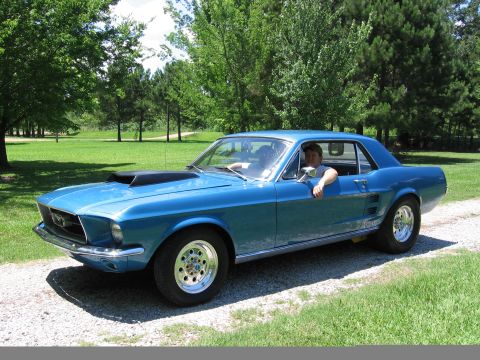
1969 Ford Mustang/
Photo
supermotors.net/registry/media/596068
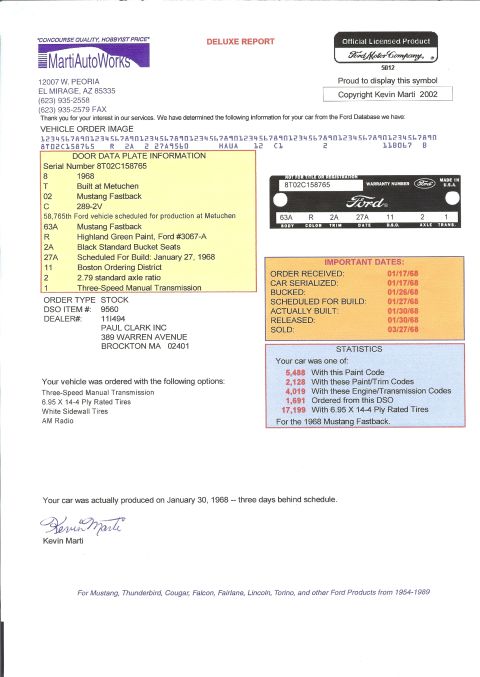
SuperFlow WinDyn Dyno Chart: STP Power & Torque vs Acceleration Rate
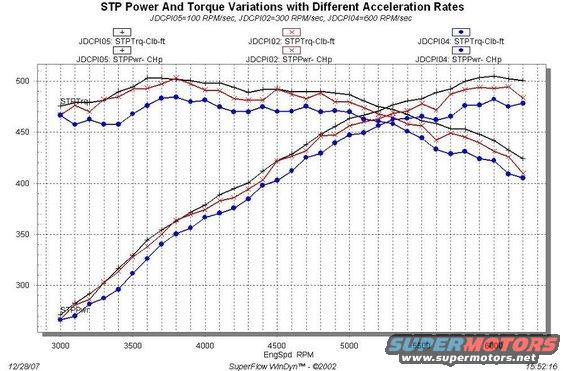
SuperFlow WinDyn dyno graph plotting horsepower and torque vs engine RPM at 100, 300, and 600 RPM/sec acceleration rates; peak around 500 hp/torque between 3500-5500 RPM.
This document is a dynamometer test chart generated by SuperFlow WinDyn software (©2002), dated 12/28/07 at 15:52:16. Titled "STP Power And Torque Variations with Different Acceleration Rates," it overlays three dyno pulls of the same engine run at different sweep (acceleration) rates: JDCPI05 at 100 RPM/sec, JDCPI02 at 300 RPM/sec, and JDCPI04 at 600 RPM/sec. For each run, both STP-corrected torque (STPTrq, Clb-ft) and STP-corrected power (STPPwr, CHp) are plotted against engine speed (EngSpd RPM) from 3000 to about 6200 RPM. Torque curves start near 460-480 lb-ft at 3000 RPM, peak around 500+ lb-ft (best on the slowest 100 RPM/sec pull), while power curves climb from roughly 265-280 hp at 3000 RPM, crossing the torque curves near 5200-5300 RPM, and peak near 500 hp at about 6000 RPM on the slowest sweep. The chart demonstrates that slower acceleration rates yield higher measured torque and power than faster sweep rates, quantifying how dyno acceleration rate affects reported STP-corrected results. No vehicle year, make, model, engine, or part numbers appear in the document.
Is this accurate? Sign in to help verify it.
Frequently asked questions
- What acceleration rates were compared in this dyno chart?
- Three sweep rates: JDCPI05 at 100 RPM/sec, JDCPI02 at 300 RPM/sec, and JDCPI04 at 600 RPM/sec.
- What RPM range does the chart cover?
- Engine speed (EngSpd RPM) from 3000 to just over 6000 RPM.
- How does acceleration rate affect the measured power and torque?
- The chart shows the slowest sweep (100 RPM/sec, JDCPI05) produces the highest STP torque and power curves, while the fastest sweep (600 RPM/sec, JDCPI04) shows the lowest readings.
- What software produced this chart and when?
- SuperFlow WinDyn™ (©2002); the chart is dated 12/28/07 at 15:52:16.
- What units are the torque and power reported in?
- STP-corrected torque in Clb-ft (corrected lb-ft) and power in CHp (corrected horsepower).
Comments
More from this build


No comments yet.