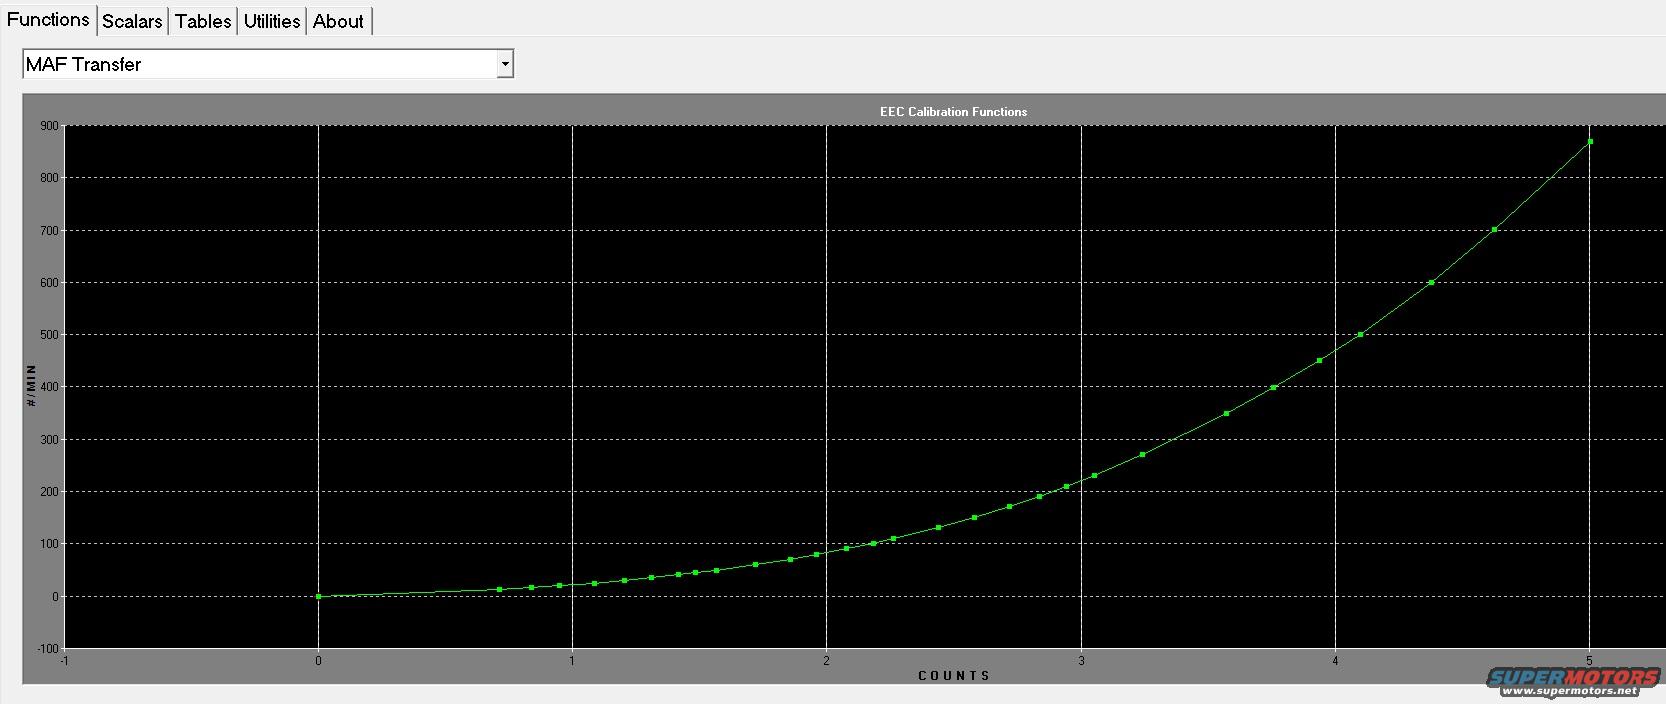
Screenshot of a computer graph showing MAF Transfer calibration…
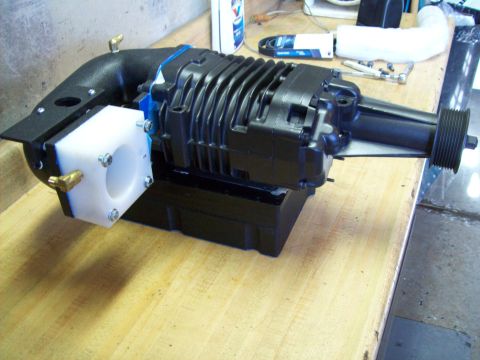
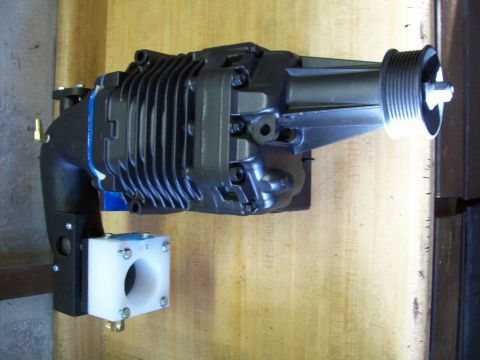
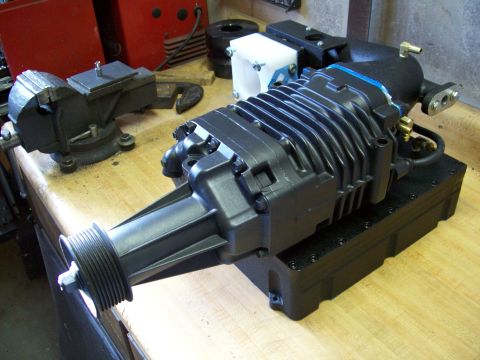
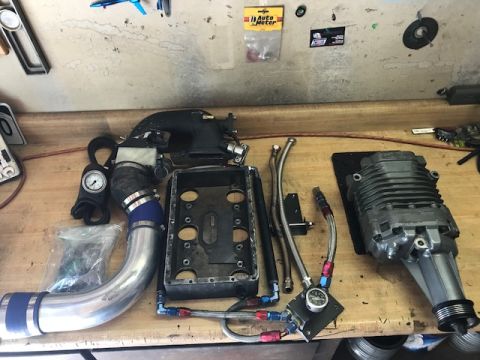
SuperchargerView all 18
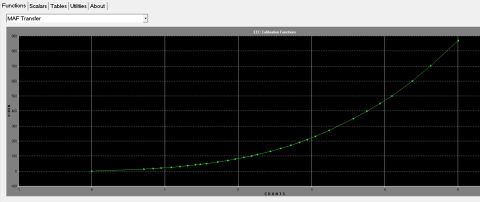
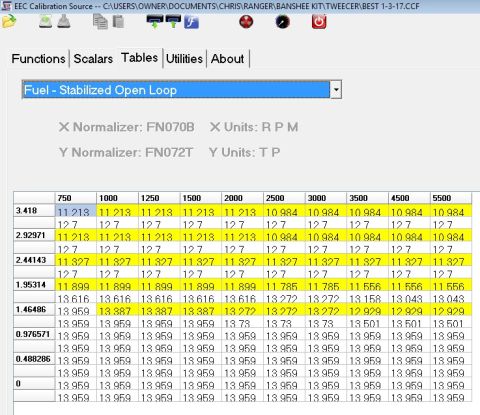
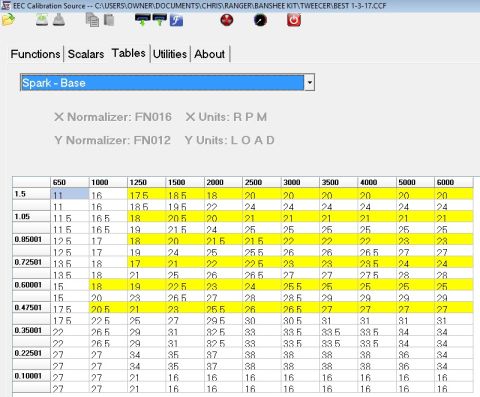
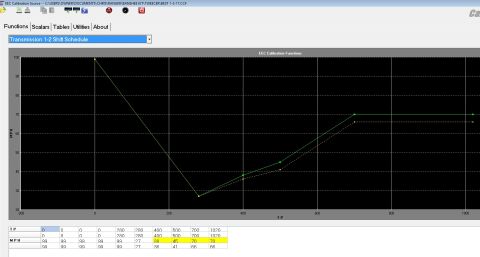
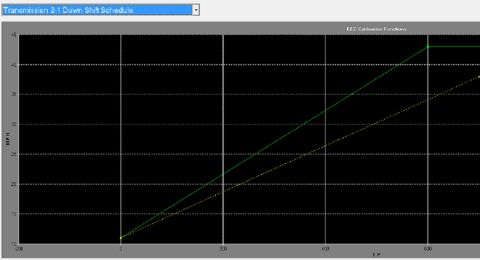


This is a screenshot of a computer program displaying a graph titled "EEC Calibration Functions" with the label "MAF Transfer" in the upper left corner. The graph plots a curve with green dots representing data points, with the x-axis labeled "COUNTS" and the y-axis labeled "#/MIN".
Is this accurate? Sign in to help verify it.






No comments yet.