
Graph displays EEC functions with MPH on the Y-axis and TP on the X-axis.
'P o 60 100 200 300 500 644 64A 1020 MP" 75 75 75 12 185 25 33 35 40 40
Comments
More from this build
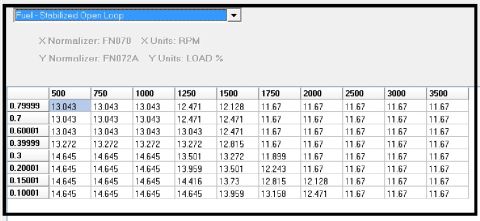
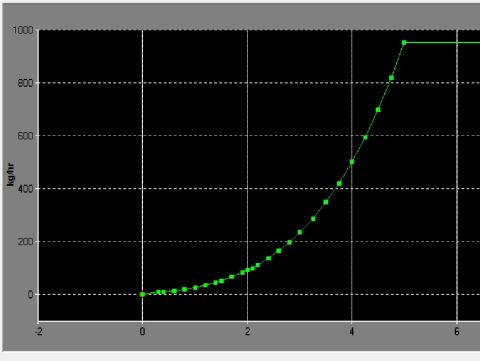
Graph displays EEC functions with MPH on the Y-axis and TP on the X-axis.


No comments yet.