
A graph displays transmission pressure functions, indicating a relationship between T P and T V values.
n: 52 300 400 644 644 1020 IV 10 10 10 10
Comments
More from this build
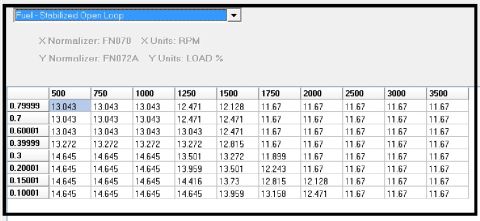
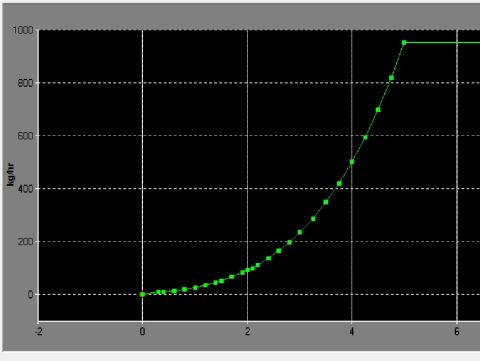
A graph displays transmission pressure functions, indicating a relationship between T P and T V values.


No comments yet.