
A graph displays EEC functions with load and row number data, alongside a table of values.
nun 0 0 01990081992 nnwu Q .o o o
Comments
More from this build
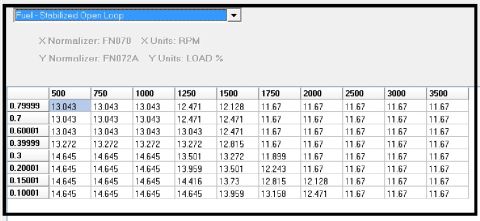
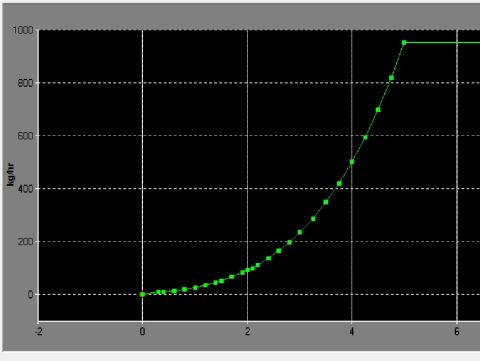
A graph displays EEC functions with load and row number data, alongside a table of values.


No comments yet.