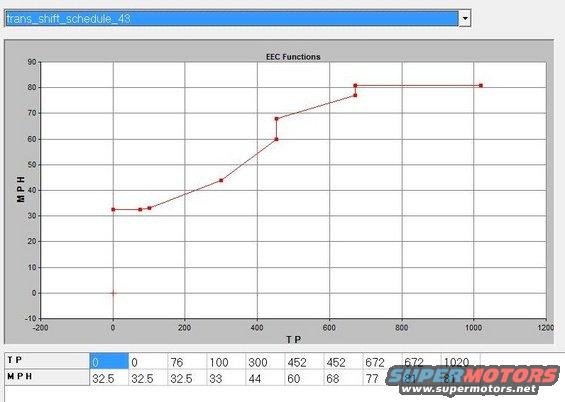
Graph displays EEC functions with MPH plotted against TP, likely related to vehicle tuning.
n: 76 100 300 452 452 672 672 1020 MPH 325 325 325 33 44 6O 68 77 81 81
Comments
More from this build
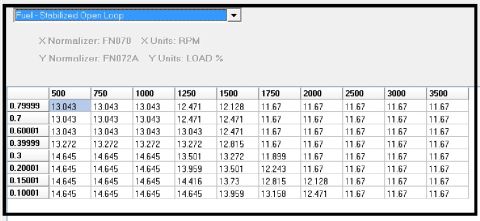
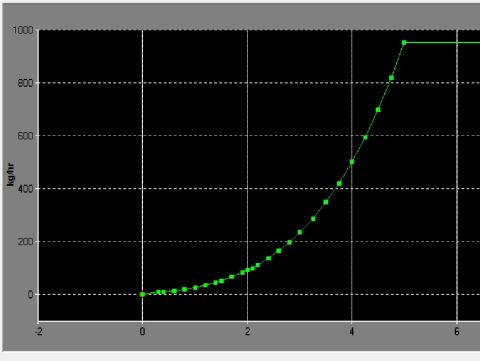
Graph displays EEC functions with MPH plotted against TP, likely related to vehicle tuning.


No comments yet.