Dyno chart graphing horsepower and torque versus engine RPM
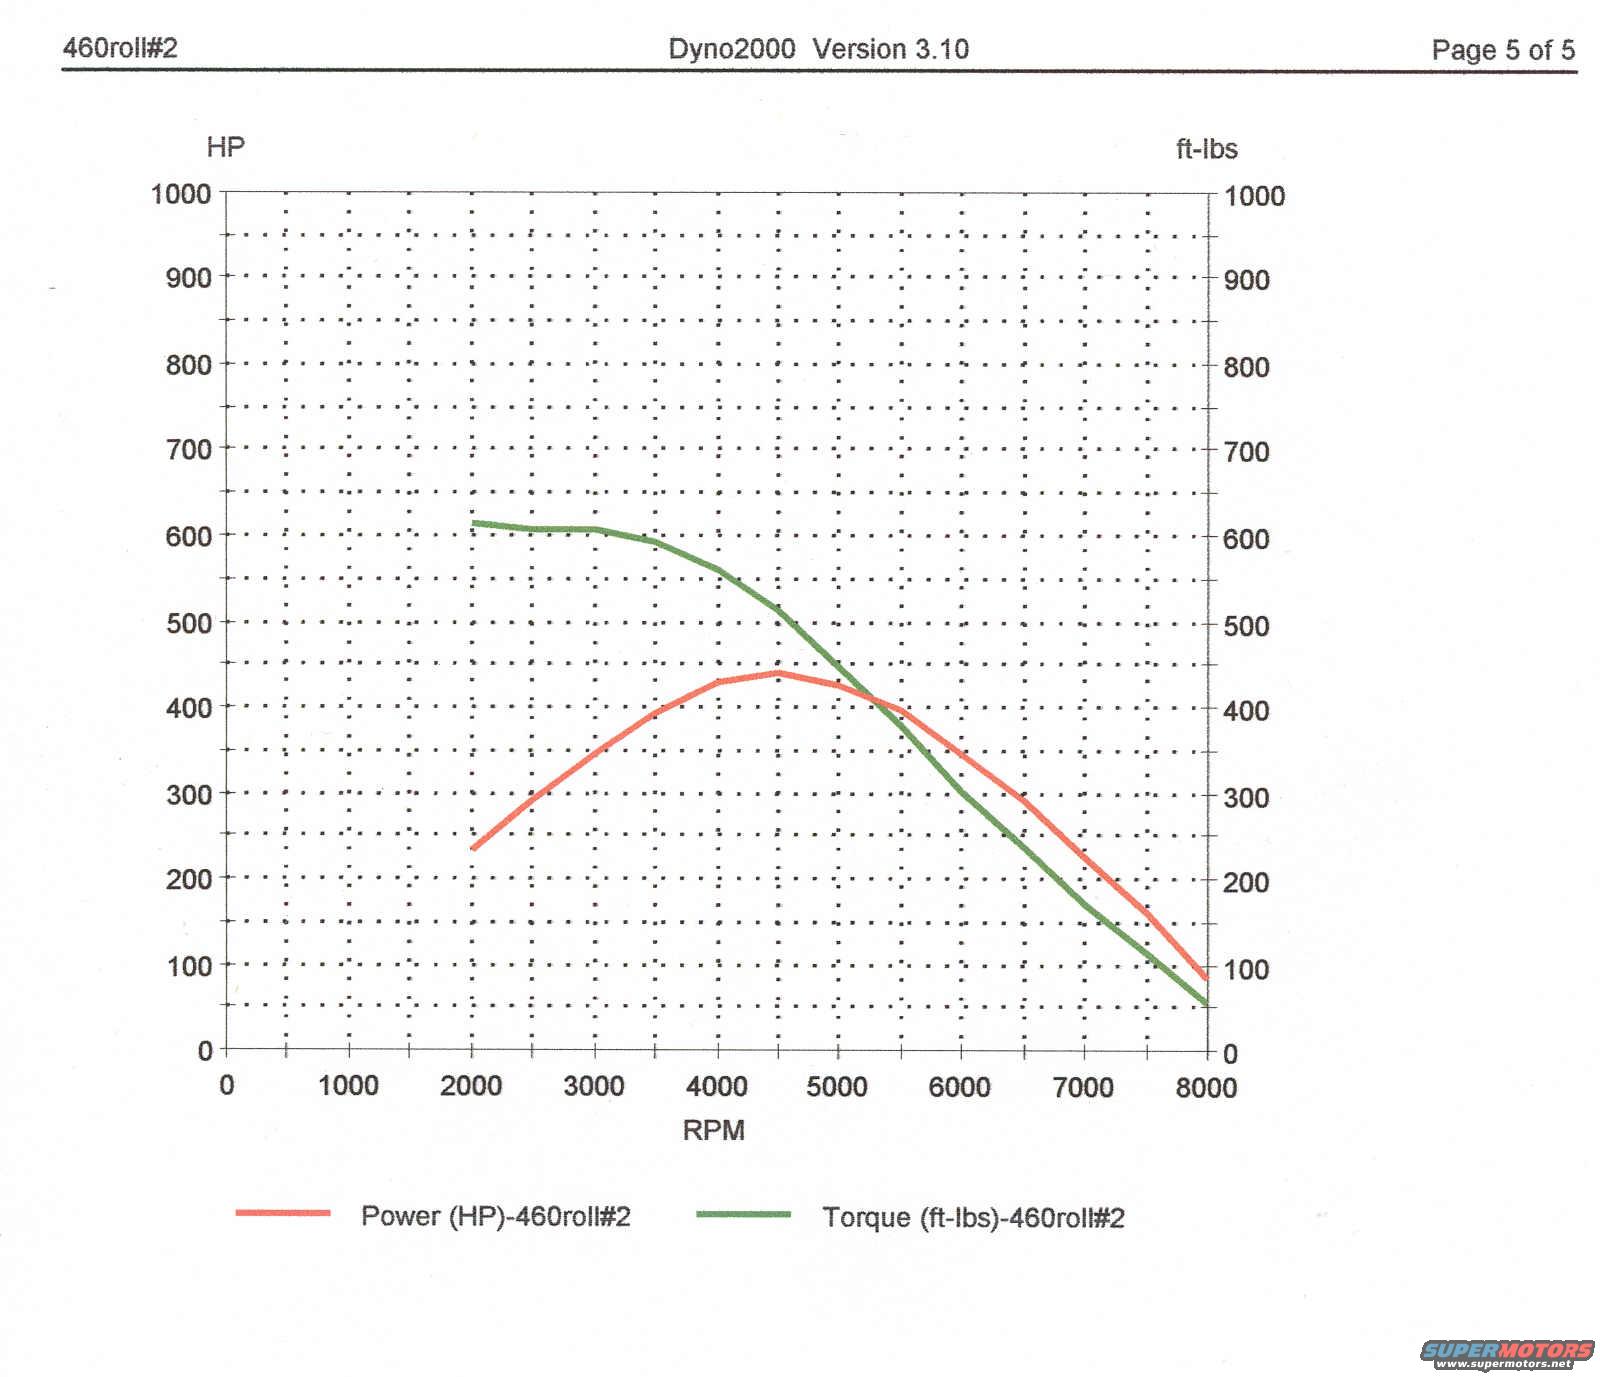
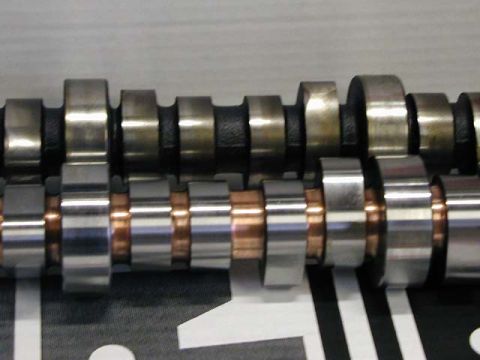
Dynamometer performance chart plotting power (HP) and torque (ft-lbs) curves against engine RPM.
460roll#2 Dyn02000 Version 3.10 Page 5 of 5 1000 900 0 1000 2000 3000 4000 5000 6000 7000 8000 Power (HP)-460roll#2 Tonque (-lbs)460roll#2
Is this accurate? Sign in to help verify it.
No comments yet.