Excel dyno graph comparing old and new 408 horsepower and torque…

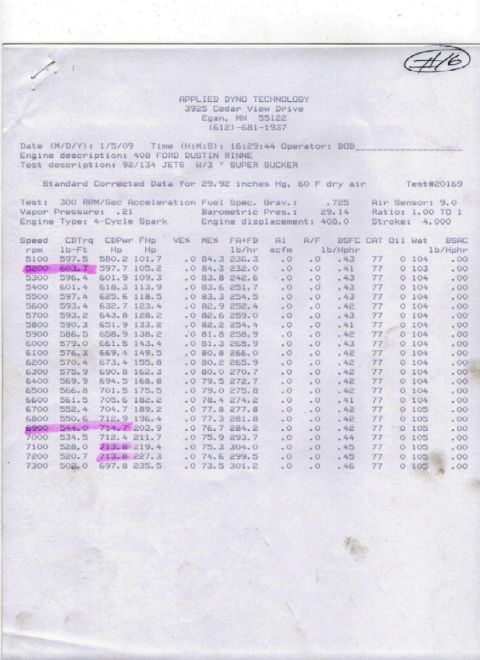
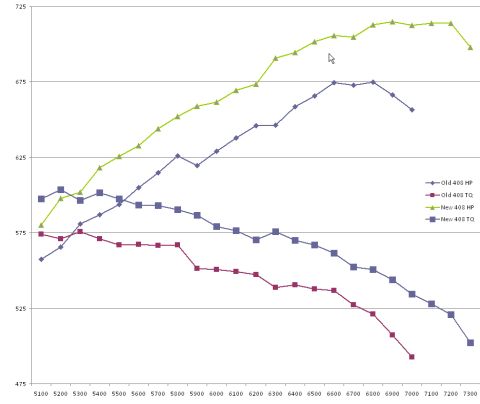
Excel line chart comparing dyno results for an old and new 408 engine build across 5100-7300 rpm, with a legend for Old 408 HP, Old 408 TQ, New 408 HP and New 408 TQ. The green New 408 HP curve climbs to roughly 715 hp near 6900-7100 rpm, above the blue old build's peak of about 675 hp.
Is this accurate? Sign in to help verify it.
No comments yet.