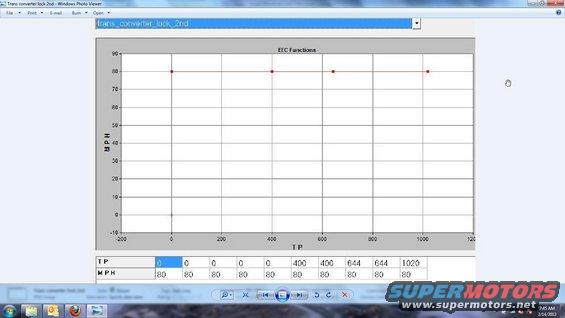
A graph displays EEC functions with plotted data points for TP and MPH.
3 3 E S E IICW ii and 320 _400 _400 .644 80 _644 80 7'45 AM 7
Comments
More from this build
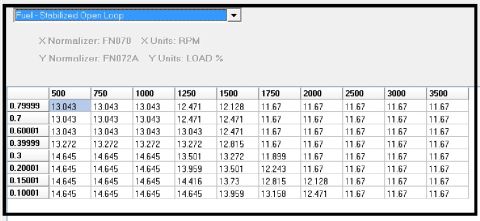
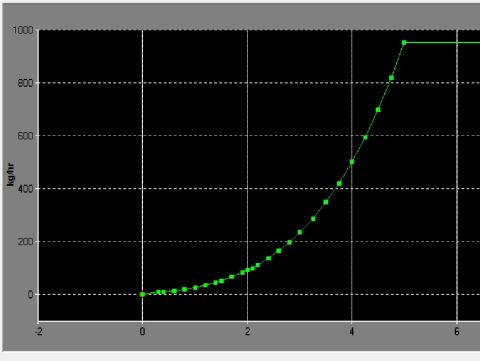
A graph displays EEC functions with plotted data points for TP and MPH.


No comments yet.