
This graph displays EEC functions, plotting MPH against TP with specific data points indicated.
n: 200 644 1020 MPH 60 ho WOO
Comments
More from this build
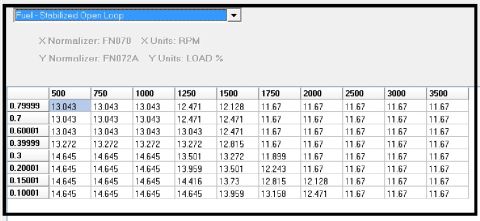
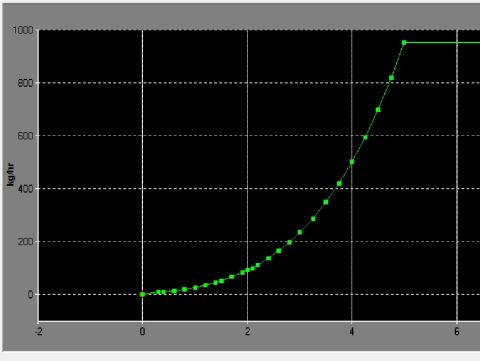


This graph displays EEC functions, plotting MPH against TP with specific data points indicated.


No comments yet.