Dyno chart with green torque curve peaking near 370 and red hors…
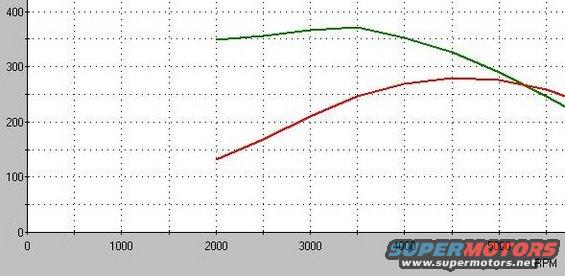
Dyno simulation chart plotting two curves against RPM on a gridded white field: a green torque line starting near 350 at 2000 RPM and peaking around 370 at about 3500 RPM, and a red horsepower line climbing from roughly 130 to a peak near 275 around 4700-5000 RPM before tapering off.
mu mu mu m mn 2nnn annn onnn snnn aw
Is this accurate? Sign in to help verify it.
Comments
More from this build
No comments yet.