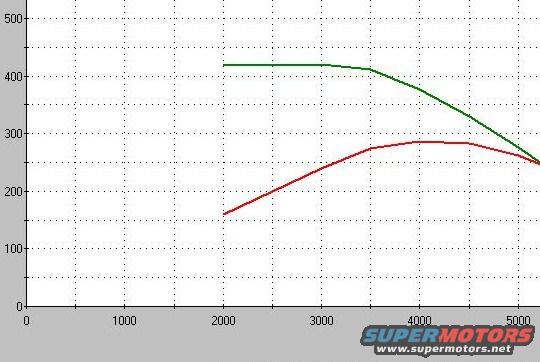
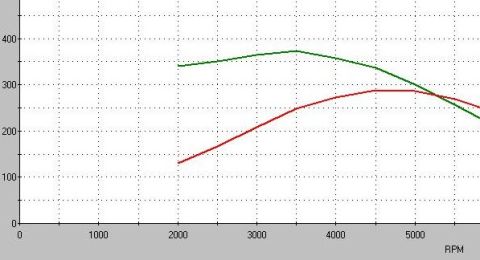
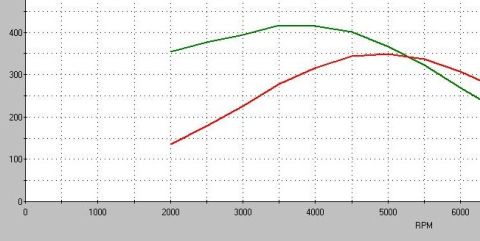
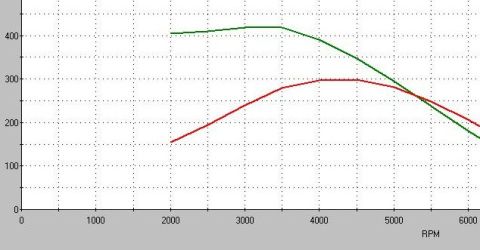
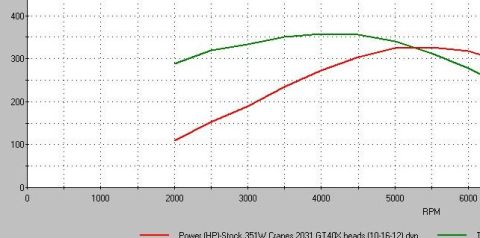
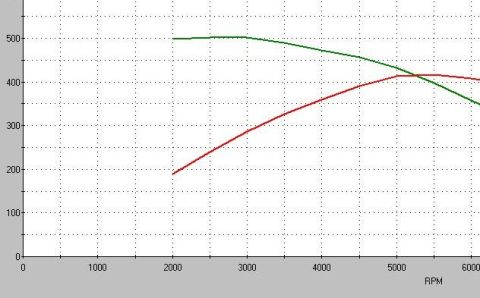
Engine dyno chart with green torque and red horsepower curves pl…
Desktop Dyno 2000View all 42
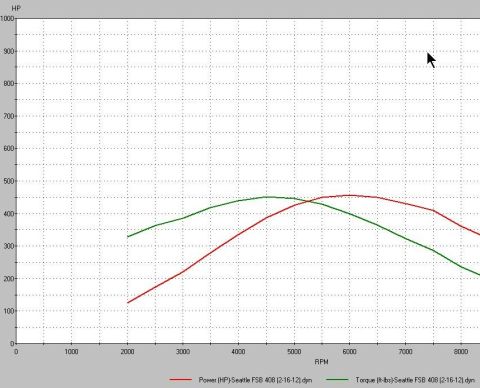
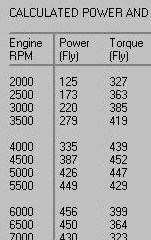
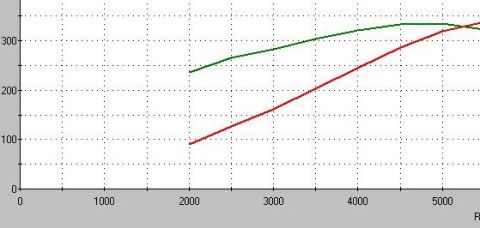
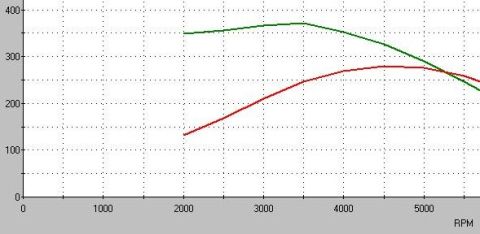
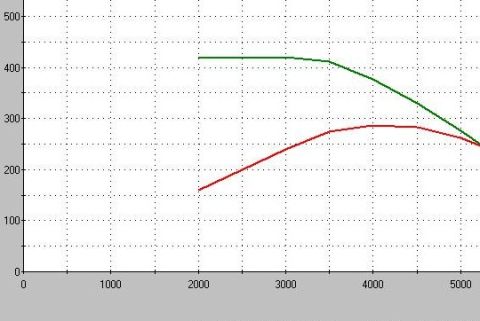
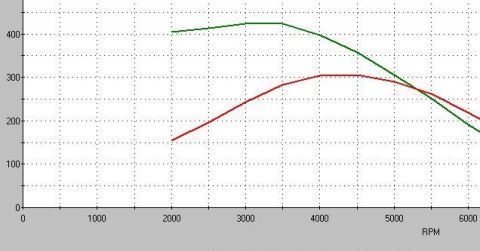
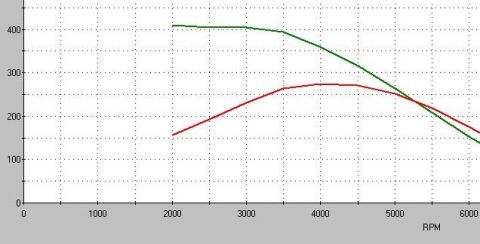
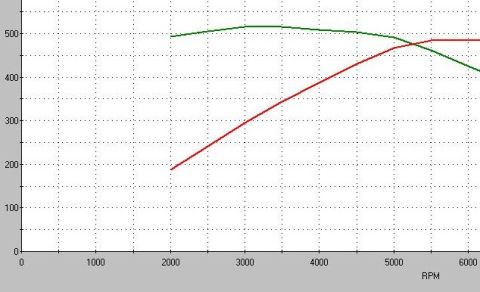
Screenshot of an engine simulation chart plotting two curves against rpm on a gray grid: a green torque line holding roughly 420 from 2000 to 3000 rpm before falling off, and a red horsepower line climbing from about 160 to a peak near 285 around 4000-4500 rpm. Both curves converge near 250 at about 5200 rpm.
Is this accurate? Sign in to help verify it.
No comments yet.