Home/
Registry/
Ford/
Crown Victoria/
1998-2011/
2002 Ford Crown Victoria/
Photo
supermotors.net/registry/media/577467
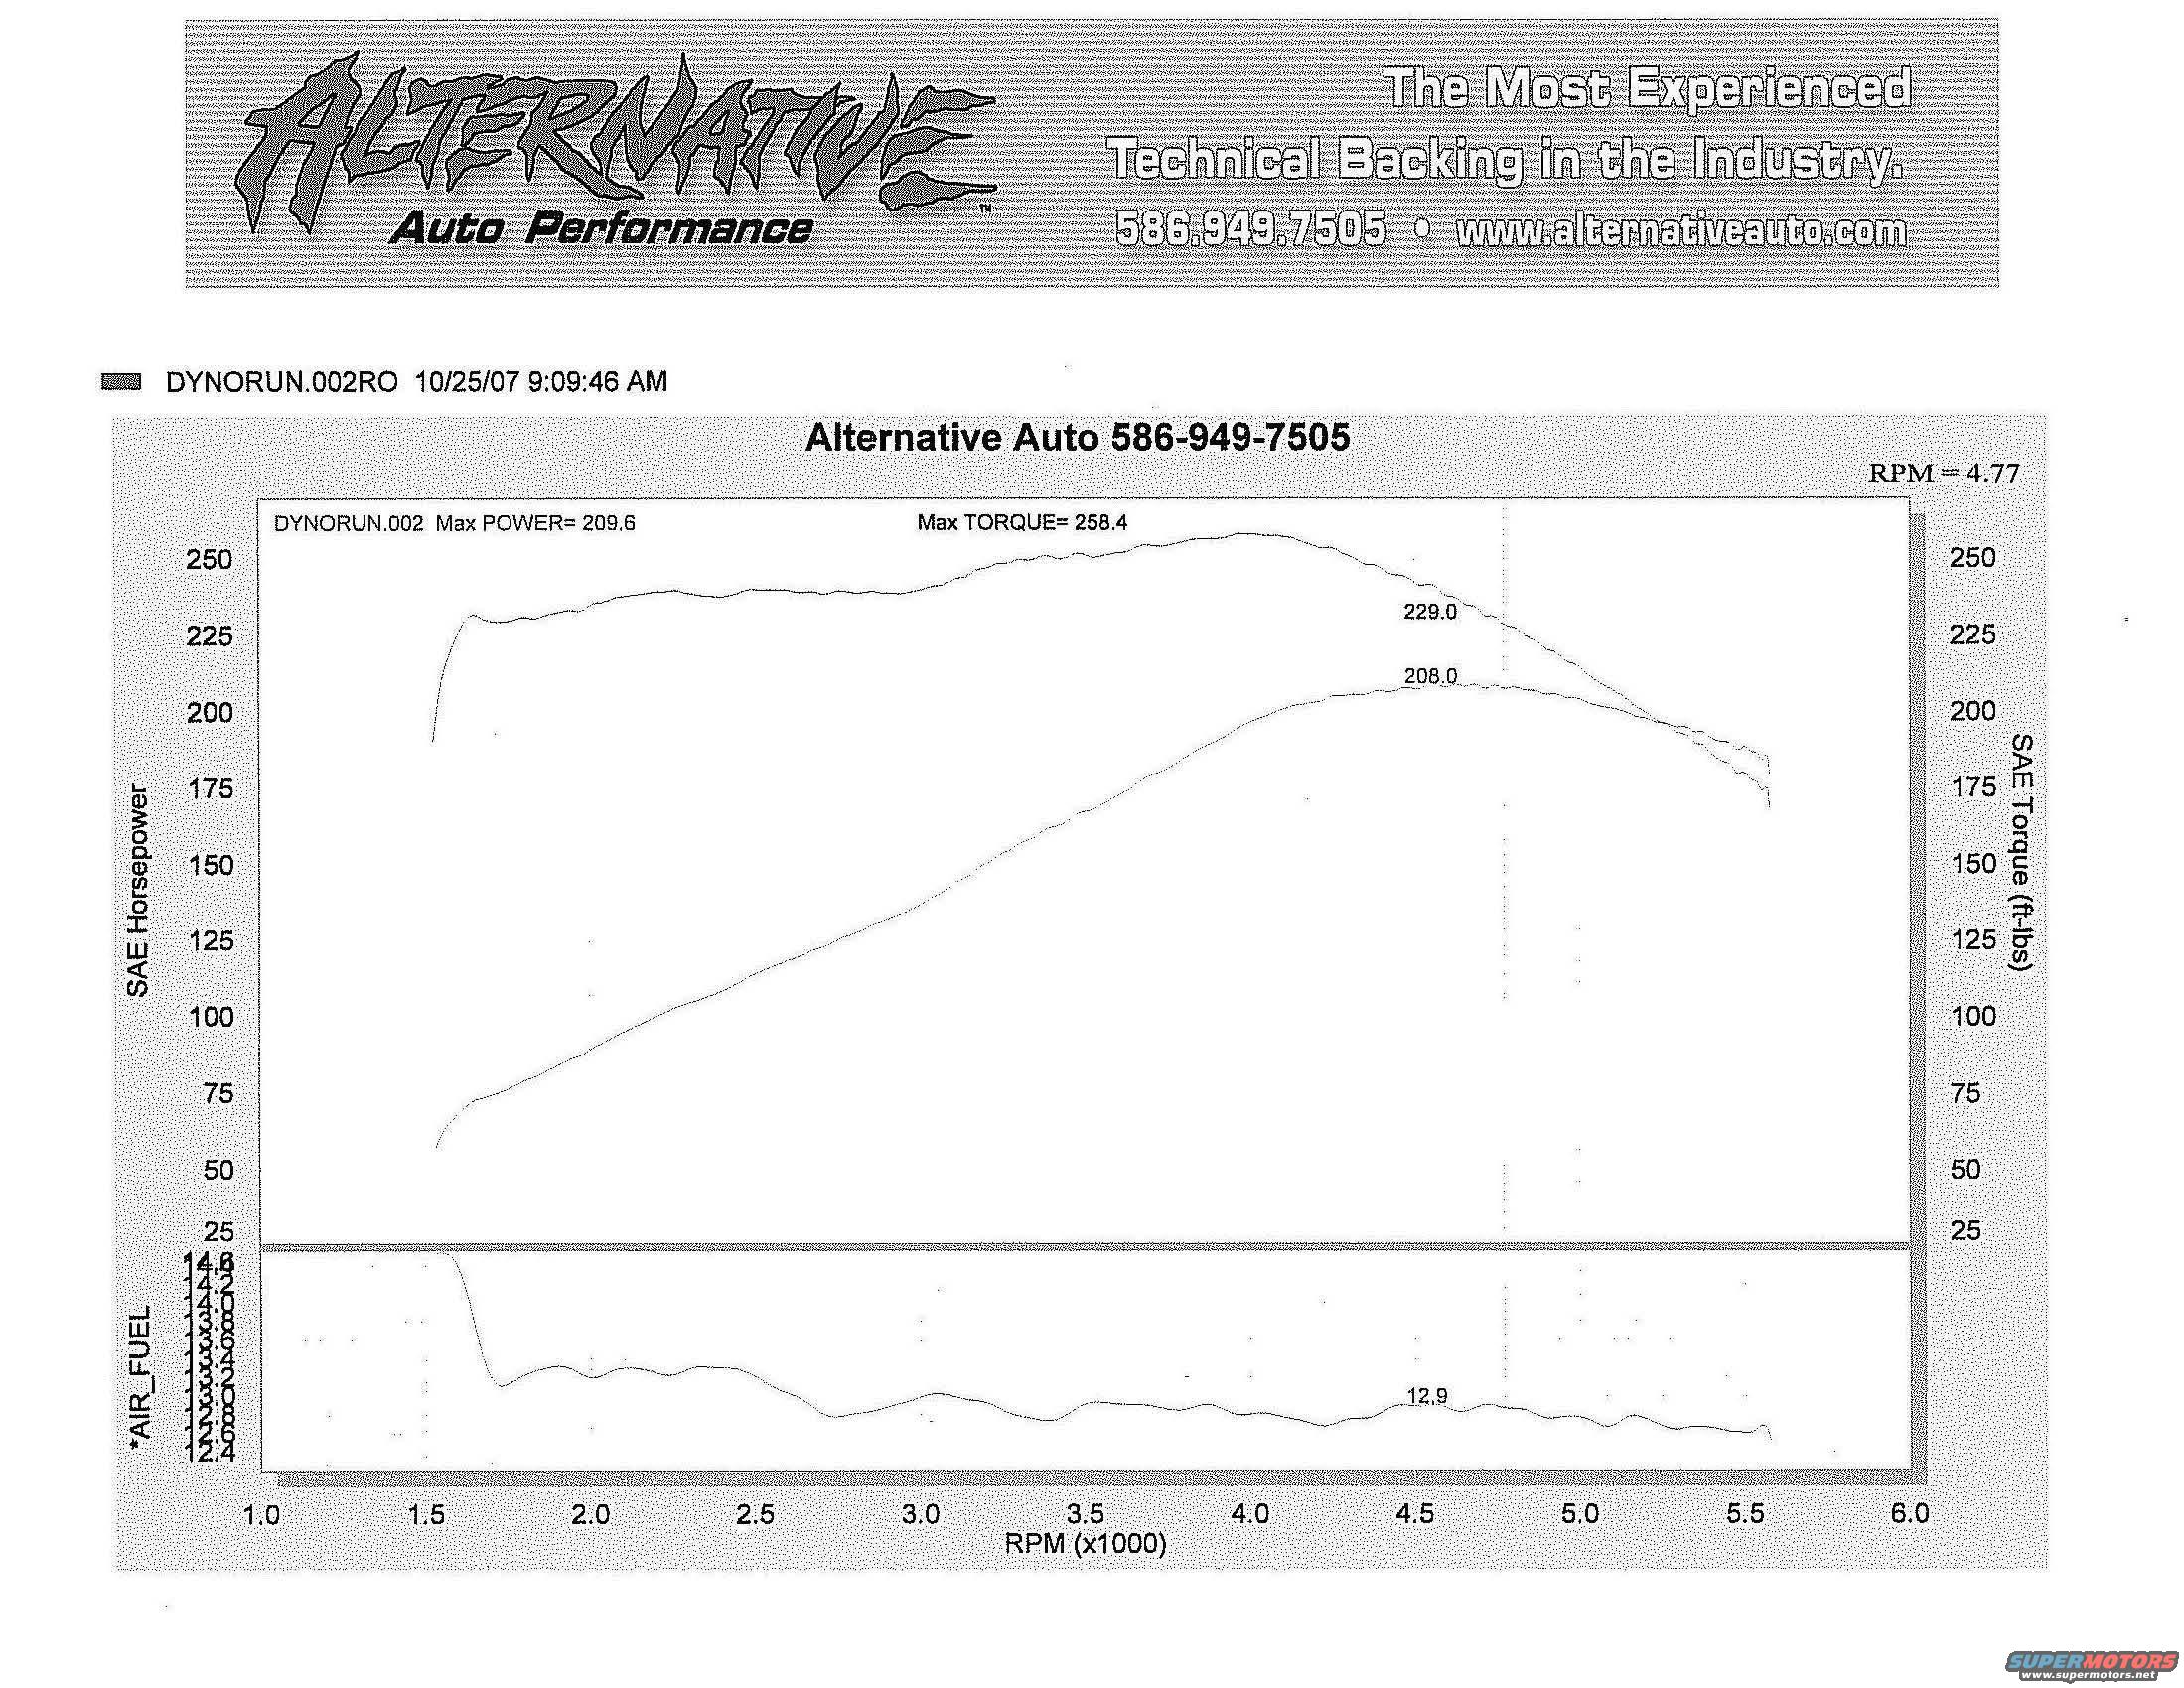
Alternative Auto Dyno Sheet 10/25/07 - 209.6 HP / 258.4 ft-lb (Crown Victoria)
Reference · 1998-2011 Crown VictoriaAll 80 data & spec plates

Alternative Auto Performance dyno graph (DYNORUN.002, 10/25/07): max power 209.6 hp, max torque 258.4 lb-ft, with SAE horsepower/torque curves and air/fuel ratio trace across RPM.
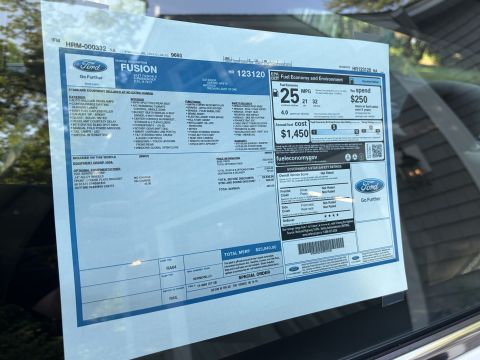
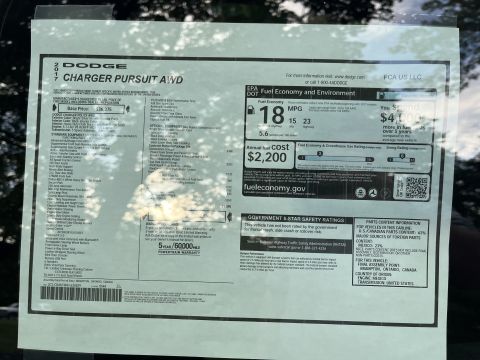
Part of 1998-2011 Ford Crown Victoria Data & Spec Plates
This document is a chassis dynamometer (dyno) result sheet printed by Alternative Auto Performance (phone 586-949-7505, www.alternativeauto.com), dated 10/25/07 at 9:09:46 AM, for a run labeled DYNORUN.002. The graph plots SAE Horsepower and SAE Torque (ft-lbs) against engine RPM (from roughly 1,500 to about 5,600 RPM), with a secondary lower plot of the measured air/fuel ratio (*AIR_FUEL) over the same RPM range. The header states the peak results: Max POWER = 209.6 hp and Max TORQUE = 258.4 ft-lbs (SAE-corrected, measured at the wheels on the dyno). A cursor marker at RPM = 4.77 (4,770 RPM) shows curve values of 229.0 ft-lbs torque and 208.0 hp at that point. The air/fuel trace runs roughly in the high-12s to low-13s through the pull, with a labeled value of 12.9 near the upper RPM range, indicating a rich, power-oriented mixture. The torque curve is broad and flat, holding above roughly 225 ft-lbs from about 1,700 RPM through 4,500 RPM before tapering off. The sheet was uploaded by an owner as documentation for a 2002 Ford Crown Victoria, though the printout itself does not identify the vehicle, engine, or modifications tested.
Is this accurate? Sign in to help verify it.
Frequently asked questions
- What peak horsepower and torque are shown on this dyno sheet?
- The sheet lists Max POWER = 209.6 hp and Max TORQUE = 258.4 ft-lbs for run DYNORUN.002.
- Who performed this dyno run and when?
- Alternative Auto Performance (586-949-7505, www.alternativeauto.com); the run DYNORUN.002RO is dated 10/25/07 at 9:09:46 AM.
- What air/fuel ratio does the graph show during the pull?
- The *AIR_FUEL trace runs roughly between 12.4 and 13.4 on the plotted scale, with a labeled value of 12.9 in the upper RPM range.
- What RPM range does the dyno graph cover?
- The X axis is RPM (x1000) from 1.0 to 6.0, with the plotted curves running from about 1,500 RPM to roughly 5,600 RPM. A cursor at RPM = 4.77 shows 229.0 ft-lbs and 208.0 hp.
- Does the dyno sheet identify the vehicle tested?
- No. The printout shows only the shop name, run label DYNORUN.002, date, and the measured curves; no vehicle year, make, model, or engine is stated on the document.

No comments yet.