Home/
Registry/
Ford/
Probe/
1989-1992/
1989 Ford Probe/
Photo
supermotors.net/registry/media/513955
Dynojet Dyno Chart - 3 Runs, 185.66 HP / 246.96 ft-lbs Max (SAE Corrected)
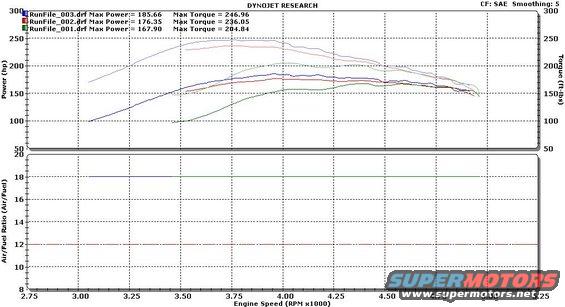
Dynojet Research power/torque graph overlaying three runs; best run peaks at 185.66 hp and 246.96 lb-ft, with a flat ~12-13:1 air/fuel ratio plotted from 2.75k to 4.5k+ rpm.
This document is a Dynojet Research chassis dynamometer chart showing three dyno runs (RunFile_001.drf, RunFile_002.drf, RunFile_003.drf) with SAE correction factor and smoothing set to 5. The upper graph plots Power (hp) and Torque (ft-lbs) against engine speed from roughly 2.75 to 5.25 RPM x1000. The legend records peak values: RunFile_003 produced a maximum of 185.66 hp and 246.96 ft-lbs of torque; RunFile_002 produced 176.35 hp and 236.05 ft-lbs; and RunFile_001 produced 167.90 hp and 204.84 ft-lbs. Power curves peak around 4.0 RPM x1000 (4,000 RPM), while torque curves peak between about 3.75 and 4.0 RPM x1000. The lower graph shows Air/Fuel Ratio traces over the same RPM range: one flat trace at approximately 18:1 and another flat trace at approximately 12:1, suggesting fixed or reference AFR readings rather than dynamic wideband data. The chart demonstrates progressive power gains across the three runs, with roughly 18 hp and 42 ft-lbs gained between the baseline (RunFile_001) and best run (RunFile_003). The document itself contains no vehicle, engine, date, or tuning-modification identification.
Is this accurate? Sign in to help verify it.
Frequently asked questions
- What was the highest power recorded on this dyno chart?
- RunFile_003.drf shows the highest output with a max power of 185.66 hp and max torque of 246.96 ft-lbs.
- What were the results of the three dyno runs?
- RunFile_001: 167.90 hp / 204.84 ft-lbs; RunFile_002: 176.35 hp / 236.05 ft-lbs; RunFile_003: 185.66 hp / 246.96 ft-lbs.
- What correction factor and smoothing were used?
- The chart is labeled CF: SAE with Smoothing: 5.
- Over what RPM range were the runs recorded?
- The x-axis (Engine Speed, RPM x1000) spans 2.75 to 5.25, i.e., roughly 2,750 to 5,250 RPM, with curves running from about 3,000 to just under 5,000 RPM.
- What air/fuel ratios are shown?
- The lower graph shows two flat air/fuel ratio traces, one at approximately 18:1 and one at approximately 12:1, across the full RPM range.
Comments
More from this build





No comments yet.