Home/
Registry/
Ford/
Probe/
1989-1992/
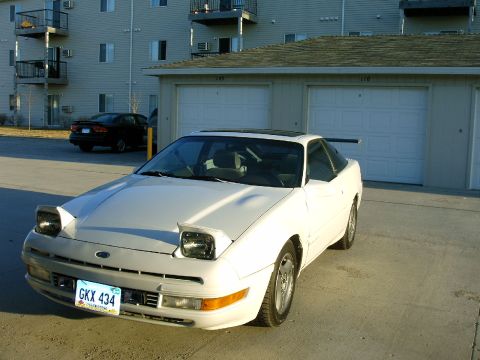
1989 Ford Probe/
Photo
supermotors.net/registry/media/513957
1989 Ford Probe Dynojet Dyno Graph – 189 hp / 231 ft-lb Runs with AFR Chart
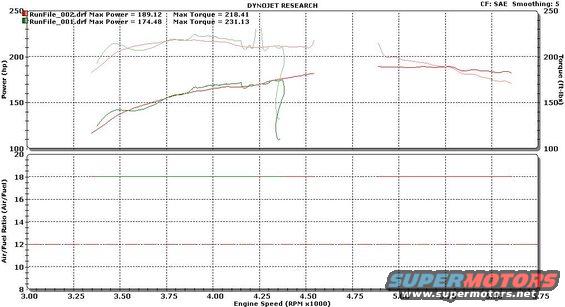
Dynojet Research power/torque graph; best of two runs reaches 189.12 hp and 218.41 lb-ft (other run 174.48 hp / 231.13 lb-ft), air/fuel held near 12:1 across 3.25k-5.75k rpm.
This document is a Dynojet Research chassis dynamometer graph comparing two dyno runs, labeled RunFile_002.drf (red) and RunFile_001.drf (green). The correction factor is SAE with a smoothing setting of 5. The red run (RunFile_002) shows a maximum power of 189.12 hp and maximum torque of 218.41 ft-lbs, while the green run (RunFile_001) shows a maximum power of 174.48 hp and maximum torque of 231.13 ft-lbs. The upper chart plots Power (hp) on the left axis and Torque (ft-lbs) on the right axis, both scaled 100–250, against Engine Speed from 3,000 to 5,750 RPM. Torque traces run in the low-to-mid 200s ft-lbs between roughly 3,300 and 4,500 RPM, while power climbs from about 115 hp near 3,300 RPM to roughly 180–190 hp by 4,500–5,600 RPM. The green run ends around 4,350 RPM with a sharp drop, while the red run continues to about 5,600 RPM. A lower chart shows Air/Fuel Ratio on a scale of 8–20, with flat reference-style traces at approximately 12 and 18. The document was uploaded as part of an album ('dyno1.JPG') for a 1989 Ford Probe, though the graph itself contains no vehicle identification.
Is this accurate? Sign in to help verify it.
Frequently asked questions
- What was the maximum power recorded on these dyno runs?
- RunFile_002.drf recorded a max power of 189.12 hp, and RunFile_001.drf recorded a max power of 174.48 hp.
- What was the peak torque on each run?
- RunFile_001.drf shows max torque of 231.13 ft-lbs, while RunFile_002.drf shows max torque of 218.41 ft-lbs.
- What correction factor and smoothing were used?
- The graph header shows CF: SAE with Smoothing: 5.
- What RPM range does the dyno graph cover?
- The engine speed axis spans 3,000 to 5,750 RPM (3.00 to 5.75 x1000).
- What does the lower chart show?
- It plots Air/Fuel Ratio on a scale of 8 to 20, with flat traces at approximately 12 and 18.
Comments
More from this build




No comments yet.