Wheel Rate Leverage Ratio Diagram - Spring Position vs Wheel (Figure A.1)
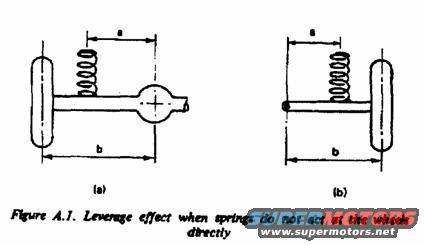
Scanned manual page figure A.1 illustrating the leverage effect when a torque-wrench spring does not act at the wheel directly.
This scanned page is a single technical figure (Figure A.1) from an automotive suspension reference, illustrating the leverage effect that occurs when springs do not act directly at the wheels. Two schematic diagrams, labeled (a) and (b), each show a wheel, an axle/arm, and a coil spring mounted inboard of the wheel. Dimension "a" marks the distance from the spring's line of action to the pivot point, while dimension "b" marks the longer distance from the pivot to the wheel. Diagram (a) shows a configuration with a central pivot resembling a differential or ball joint at the inboard end, while diagram (b) shows a simple pivoted arm with the spring positioned between the pivot and the wheel. The figure supports the concept of wheel rate calculation, the effective spring rate at the wheel differs from the actual spring rate by the leverage (motion) ratio determined by dimensions a and b. The page contains no formulas, tables, part numbers, or vehicle-specific data; it appears to be from an appendix of a general suspension engineering text rather than a Ford-specific manual. It was uploaded to a 1993 Ford F-150 gallery as a wheel rate calculation reference.
Is this accurate? Sign in to help verify it.
Frequently asked questions
- What does Figure A.1 illustrate?
- It illustrates the leverage effect that occurs when springs do not act at the wheels directly, showing two suspension arm configurations (a) and (b).
- What do the dimensions 'a' and 'b' represent in the figure?
- Dimension 'a' is the distance from the spring's location to the pivot point, and dimension 'b' is the longer distance from the pivot to the wheel, defining the leverage ratio.
- Does this page give a formula for calculating wheel rate?
- No. This page contains only the diagrams and caption; no equations or numerical values are shown.
- Is this document specific to a particular vehicle?
- No. The figure is a generic suspension schematic with no vehicle make, model, or year stated.
Comments
More from this build
No comments yet.