1993 Ford F-150 Dyno Sheet - 270 HP / 384 TQ Boosted Dynojet Results
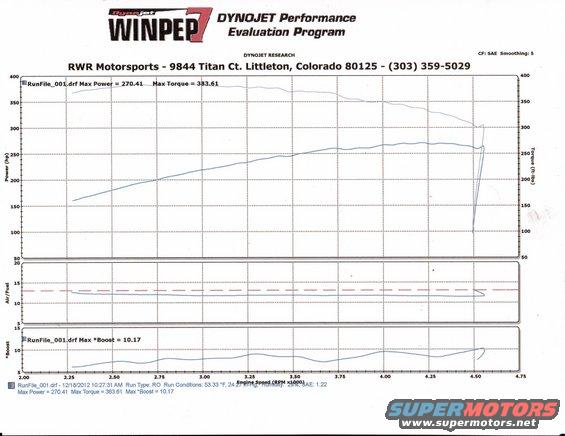
Dynojet WinPEP dyno graph from RWR Motorsports (Littleton, CO) showing peak 270.41 hp and 383.61 ft-lbs torque with air/fuel and 10.17 psi max boost traces.
This document is a Dynojet WINPEP 7 chassis dynamometer results sheet printed by RWR Motorsports of 9844 Titan Ct., Littleton, Colorado 80125 (phone 303-359-5029), dated December 18, 2012 at 10:27:31 AM. The sheet plots three stacked graphs versus engine speed (2,000-4,750 RPM) for run file RunFile_001.drf: power and torque, air/fuel ratio, and boost pressure. The run recorded a maximum power of 270.41 hp and maximum torque of 383.61 ft-lbs (SAE corrected, smoothing 5, correction factor 1.22). Torque peaks early (roughly 380+ ft-lbs near 2,300-3,000 RPM) and tapers to about 300 ft-lbs near 4,500 RPM, while horsepower climbs steadily to its peak near the top of the run. The air/fuel trace holds around 12.0-12.5:1 across the pull, richer than the dashed target line near 13.2. Boost rises from about 6 psi at 2,250 RPM to a maximum of 10.17 psi near redline. Run conditions were 53.33 °F, 24.27 in-Hg barometric pressure, and 29% humidity, indicating a high-altitude test consistent with the Colorado location. The document itself does not identify the vehicle, engine, or model year tested.
Is this accurate? Sign in to help verify it.
Frequently asked questions
- What were the peak power and torque numbers on this dyno run?
- Max Power was 270.41 hp and Max Torque was 383.61 ft-lbs (SAE corrected, smoothing 5, SAE correction factor 1.22).
- How much boost did the engine make on this dyno pull?
- The maximum recorded boost was 10.17 psi, rising from roughly 6 psi at about 2,250 RPM to the peak near the end of the run around 4,500 RPM.
- Where and when was this dyno test performed?
- At RWR Motorsports, 9844 Titan Ct., Littleton, Colorado 80125 (303-359-5029), on 12/18/2012 at 10:27:31 AM.
- What were the atmospheric conditions during the run?
- 53.33 °F, 24.27 in-Hg barometric pressure, and 29% humidity, with an SAE correction factor of 1.22.
- What air/fuel ratio did the engine run during the pull?
- The measured A/F trace stayed around 12.0-12.5:1 through the run, slightly richer than the dashed target line near 13.2.
Comments
More from this build
No comments yet.