Excess-Air Factor λ & Ignition Timing Effects on HC, NOx, CO Emissions - Manual
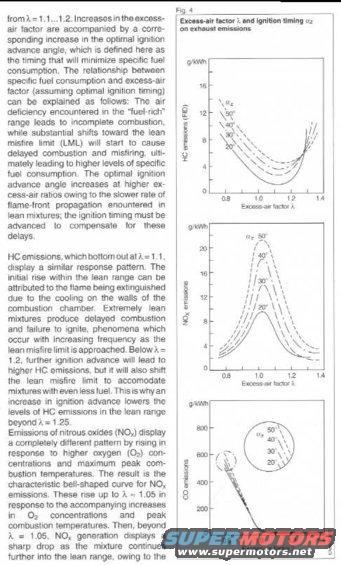
Manual page explaining excess-air factor effects on exhaust emissions, with HC, NOx, and CO emission curves.
This manual page explains the relationship between the excess-air factor (lambda, λ) and ignition timing (αz) on engine exhaust emissions and fuel consumption. The text describes how the optimal ignition advance angle increases with higher excess-air ratios due to slower flame-front propagation in lean mixtures, and how operation near the lean misfire limit (LML) causes delayed combustion, misfiring, and rising specific fuel consumption. It details HC emissions, which bottom out around λ = 1.1 and rise again in extremely lean mixtures due to flame extinguishing on combustion chamber walls, and how advancing ignition timing can lower HC emissions in the lean range beyond λ = 1.25. It also explains the characteristic bell-shaped NOx emissions curve, which peaks near λ ≈ 1.05 due to increased oxygen concentration and peak combustion temperature, then drops sharply as the mixture becomes leaner. Figure 4 presents three graphs plotting HC, NOx, and CO emissions (in g/kWh) against excess-air factor λ (0.8–1.4) for four ignition advance angles (20°, 30°, 40°, 50°). This is theory/reference material on combustion and emissions behavior rather than vehicle-specific repair data, useful for understanding how air-fuel ratio and spark timing interact to affect emissions output.
Is this accurate? Sign in to help verify it.
Frequently asked questions
- At what excess-air factor do HC emissions bottom out?
- According to the document, HC emissions bottom out at λ = 1.1.
- Why does the optimal ignition advance angle increase at higher excess-air ratios?
- Because of the slower rate of flame-front propagation in lean mixtures; ignition timing must be advanced to compensate for these combustion delays.
- At what lambda value do NOx emissions peak?
- NOx emissions rise up to about λ ≈ 1.05 due to increasing O2 concentrations and peak combustion temperatures, then drop sharply beyond λ = 1.05 as the mixture gets leaner.
- Why do HC emissions rise again in very lean mixtures?
- The initial rise in the lean range is attributed to the flame being extinguished by cooling on the combustion chamber walls; extremely lean mixtures also produce delayed combustion and failure to ignite as the lean misfire limit is approached.
- What ignition timing angles are compared in the Figure 4 emissions graphs?
- The graphs show curves for ignition advance angles (αz) of 20°, 30°, 40°, and 50° plotted against excess-air factor λ for HC, NOx, and CO emissions in g/kWh.
Comments
More from this build

No comments yet.