Home/
Registry/
Ford/
Taurus/
1996-1999/
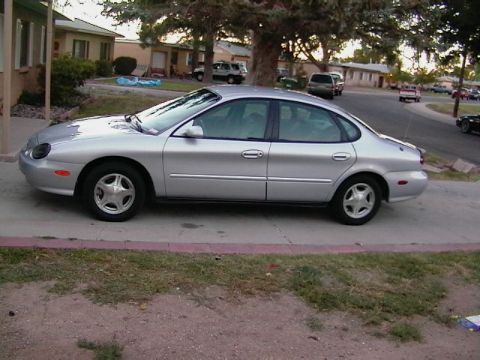
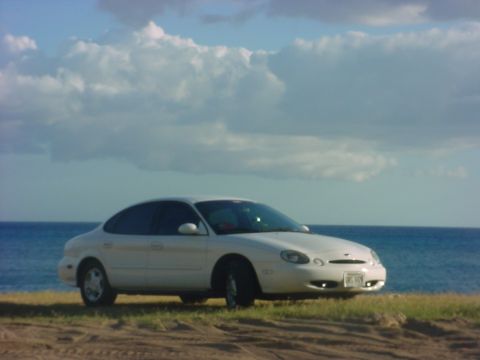
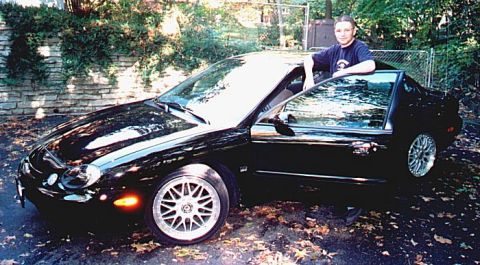
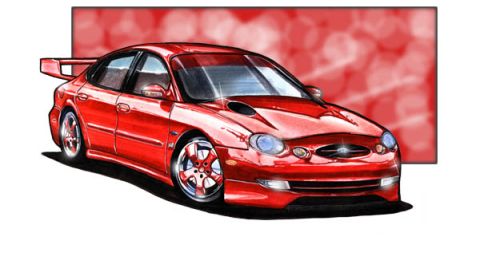
1997 Ford Taurus/
Photo
supermotors.net/registry/media/775264
Ford Flexible Fuel (FF) Sensor Ethanol Output Chart - Frequency vs % Ethanol

Reference · 1996-1999 TaurusAll 20 manual pages
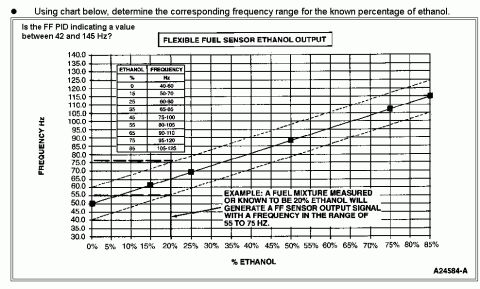
Diagnostic chart relating flexible fuel sensor output frequency in Hz to the percentage of ethanol in the fuel.
Part of 1996-1999 Ford Taurus Manual Pages
This document is a diagnostic reference chart titled "Flexible Fuel Sensor Ethanol Output," apparently from a Ford service/diagnostic manual (figure reference A24584-A). It instructs the technician to use the chart to determine the corresponding frequency range for a known percentage of ethanol in the fuel, and asks whether the FF (Flexible Fuel) PID is indicating a value between 42 and 145 Hz. The chart plots FF sensor output frequency (Hz, 30-140 on the Y-axis) against ethanol percentage (0%-85% on the X-axis), showing a nominal linear output line with upper and lower tolerance bands. An embedded table lists expected frequency ranges: 0% ethanol = 40-60 Hz, 15% = 50-70 Hz, 25% = 60-80 Hz, 35% = 65-85 Hz, 45% = 75-100 Hz, 55% = 80-105 Hz, 65% = 90-110 Hz, 75% = 95-120 Hz, and 85% = 105-125 Hz. A worked example explains that a fuel mixture known to be 20% ethanol should generate an FF sensor output signal in the range of 55 to 75 Hz. A reader can use this page to verify whether a flexible fuel sensor's output frequency is plausible for the actual ethanol content of the fuel during diagnosis.
Is this accurate? Sign in to help verify it.
Frequently asked questions
- What frequency range should the FF sensor output for E85 (85% ethanol)?
- According to the chart, 85% ethanol corresponds to an FF sensor output frequency of 105-125 Hz.
- What is the expected FF sensor frequency for 0% ethanol (straight gasoline)?
- The table shows 0% ethanol corresponds to 40-60 Hz.
- What overall FF PID frequency range does the diagnostic check for?
- The document asks whether the FF PID is indicating a value between 42 and 145 Hz.
- What frequency would a 20% ethanol fuel mixture produce?
- The example on the chart states a fuel mixture measured or known to be 20% ethanol will generate an FF sensor output signal with a frequency in the range of 55 to 75 Hz.
- How is the chart organized?
- It plots FF sensor output frequency in Hz (30-140) on the vertical axis against % ethanol (0%-85% in 5% steps) on the horizontal axis, with a table listing frequency ranges for ethanol percentages from 0% to 85%.
No comments yet.