357W GT40 Heads Isky Cam 371265-275 Dyno2000 HP & Torque Curve - Ford 351W Build
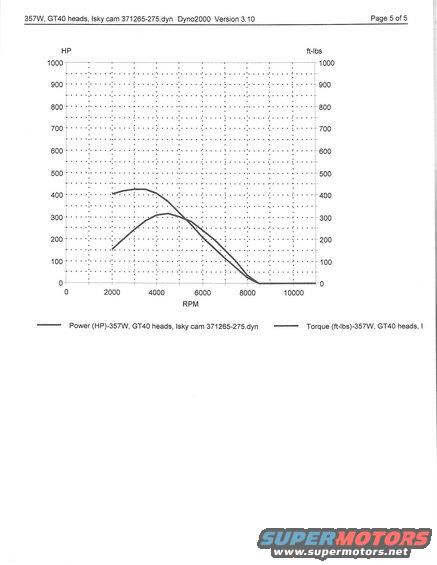
Dyno2000 power/torque vs RPM curves for a 357W with GT40 heads and a bigger Isky 265/275 cam; power peaks higher in the RPM band than the 257/265 grind.
This document is page 5 of 5 from a Dyno2000 (Version 3.10) engine simulation printout for a 357W (357 cubic inch Windsor-based) engine build equipped with Ford GT40 cylinder heads and an Isky camshaft, file name '371265-275.dyn'. The page contains a single graph plotting simulated engine Power (HP, left axis) and Torque (ft-lbs, right axis) against engine RPM (0 to about 11,000). Both axes are scaled 0-1000. From the plotted curves, torque starts near 400 ft-lbs at 2000 RPM, peaks around 420-425 ft-lbs at roughly 3000-3500 RPM, and falls off to zero by about 8500 RPM. Horsepower climbs from about 150 HP at 2000 RPM to a peak of roughly 310-315 HP near 4500 RPM before tapering off. A legend at the bottom identifies the two traces: 'Power (HP)-357W, GT40 heads, Isky cam 371265-275.dyn' and 'Torque (ft-lbs)-357W, GT40 heads' (partially cut off). A reader can learn the simulated power and torque characteristics of this 357W/GT40/Isky cam combination, including approximate peak values and the usable RPM range. No vehicle year, model, or exact numeric data table appears on this page.
Is this accurate? Sign in to help verify it.
Frequently asked questions
- What engine combination does this dyno graph represent?
- A 357W engine with GT40 heads and an Isky cam, simulation file 371265-275.dyn, run in Dyno2000 Version 3.10.
- What is the approximate peak horsepower shown on the graph?
- The power curve peaks at roughly 310-315 HP at around 4500 RPM.
- What is the approximate peak torque shown?
- Torque peaks at roughly 420-425 ft-lbs at about 3000-3500 RPM.
- Is this an actual dyno test or a simulation?
- It is a computer simulation printout from Dyno2000 Version 3.10 software, page 5 of 5.
- Over what RPM range does the engine make power in this simulation?
- The curves span from about 2000 RPM up to roughly 8500 RPM, where both power and torque fall to zero, with the graph axis extending to about 11,000 RPM.
Comments
More from this build
No comments yet.