Home/
Registry/
Ford/
Crown Victoria/
1998-2011/
“EVIL VIC”/
Photo
supermotors.net/registry/media/985573
2003 Ford Crown Victoria Dynojet Dyno Sheet - 264 HP / 290 TQ, Racers Edge Tuning

Reference · 1998-2011 Crown VictoriaAll 80 data & spec plates
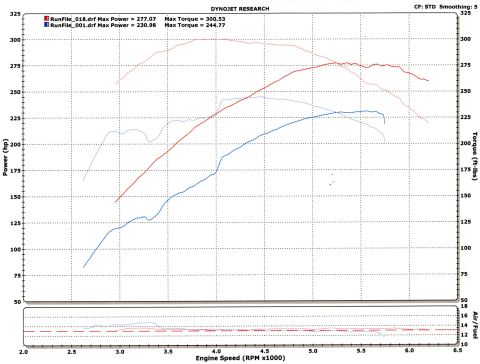
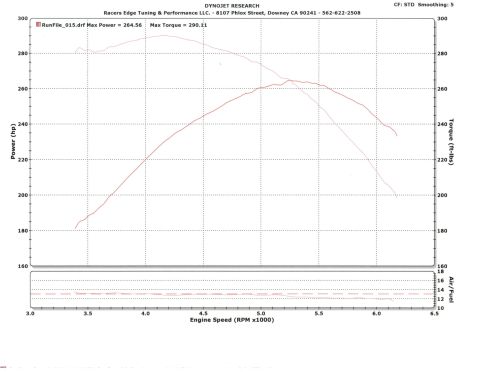
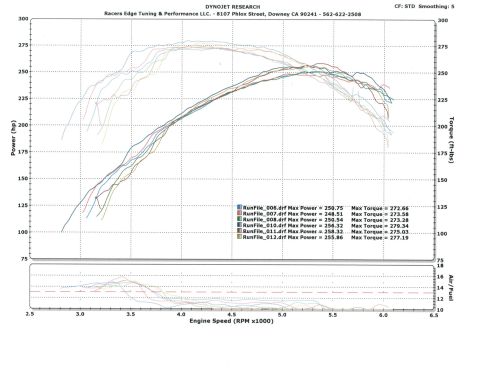
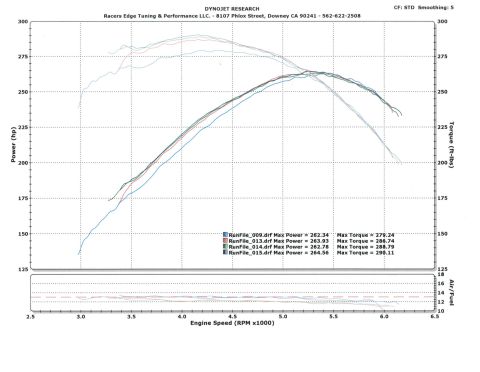
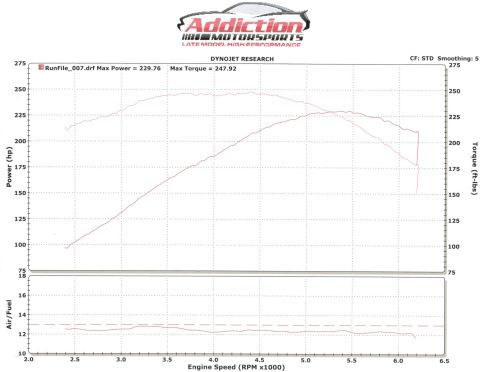
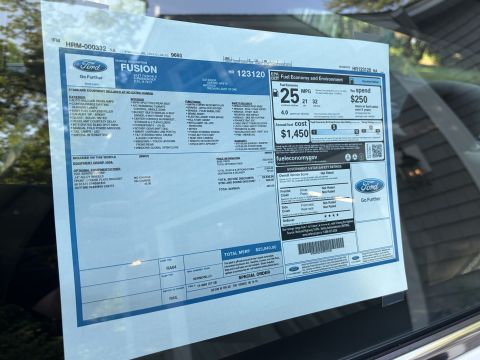
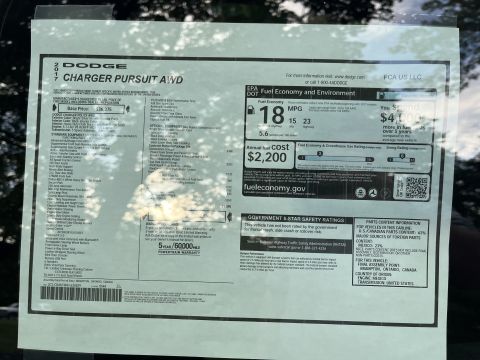
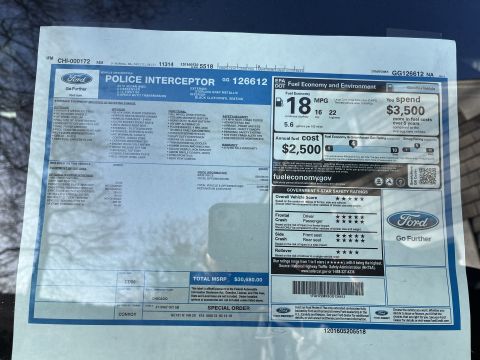
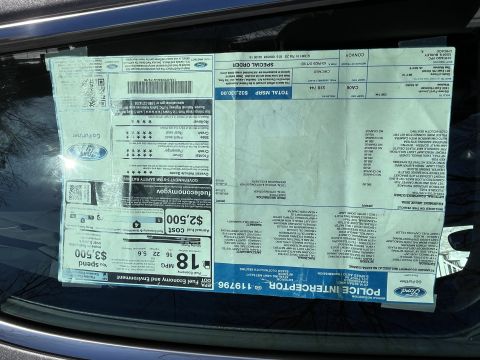
Racers Edge Tuning & Performance Dynojet chart (CF STD, smoothing 5) overlaying four runs: peak ~264.56 hp and ~290.11 ft-lb torque, with air/fuel trace below.
Part of 1998-2011 Ford Crown Victoria Data & Spec Plates
This document is a Dynojet Research chassis dynamometer graph produced by Racers Edge Tuning & Performance LLC of 8107 Phlox Street, Downey, CA 90241 (phone 562-622-2508). It overlays four dyno pulls (RunFile_009, 013, 014, and 015) showing power (hp) and torque (ft-lbs) versus engine speed from roughly 3,000 to just over 6,000 RPM, with a secondary air/fuel ratio trace plotted below hovering near 13:1 and dipping toward 12:1 at high RPM. Correction factor is STD with smoothing set to 5. Measured results are: RunFile_009-262.34 max power / 279.24 max torque; RunFile_013-263.93 / 286.74; RunFile_014-262.78 / 288.79; RunFile_015-264.56 / 290.11. The curves show torque peaking in the 4,000-4,500 RPM range and horsepower peaking around 5,200-5,500 RPM. The chart was uploaded to the gallery of a 2003 Ford Crown Victoria, and while the graph itself does not identify the vehicle, the numbers document baseline and/or tuned wheel output for the owner's car. Readers can learn peak power/torque figures, the power and torque curve shapes, and the air/fuel behavior across the RPM band for these runs.
Is this accurate? Sign in to help verify it.
Frequently asked questions
- What was the highest horsepower recorded on this dyno sheet?
- RunFile_015.drf recorded the highest max power at 264.56 hp.
- What was the highest torque recorded?
- RunFile_015.drf shows the highest max torque at 290.11 ft-lbs; the other runs recorded 279.24, 286.74, and 288.79.
- Who performed the dyno runs?
- Racers Edge Tuning & Performance LLC, 8107 Phlox Street, Downey CA 90241, phone 562-622-2508, on a Dynojet Research dynamometer.
- What correction factor and smoothing were used?
- The chart states CF: STD with Smoothing: 5.
- What does the air/fuel trace show?
- The lower plot shows air/fuel ratio staying near about 13:1 through most of the RPM range, drifting slightly richer (toward 12:1 or below) at high RPM.

No comments yet.