Home/
Registry/
Ford/
Crown Victoria/
1998-2011/
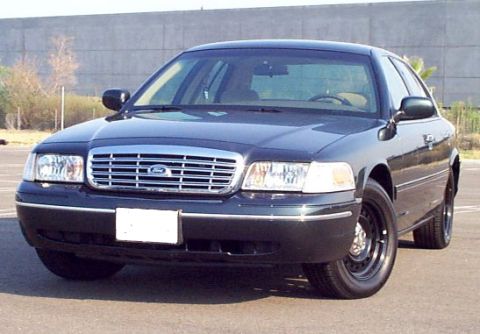
“EVIL VIC”/
Photo
supermotors.net/registry/media/1016033
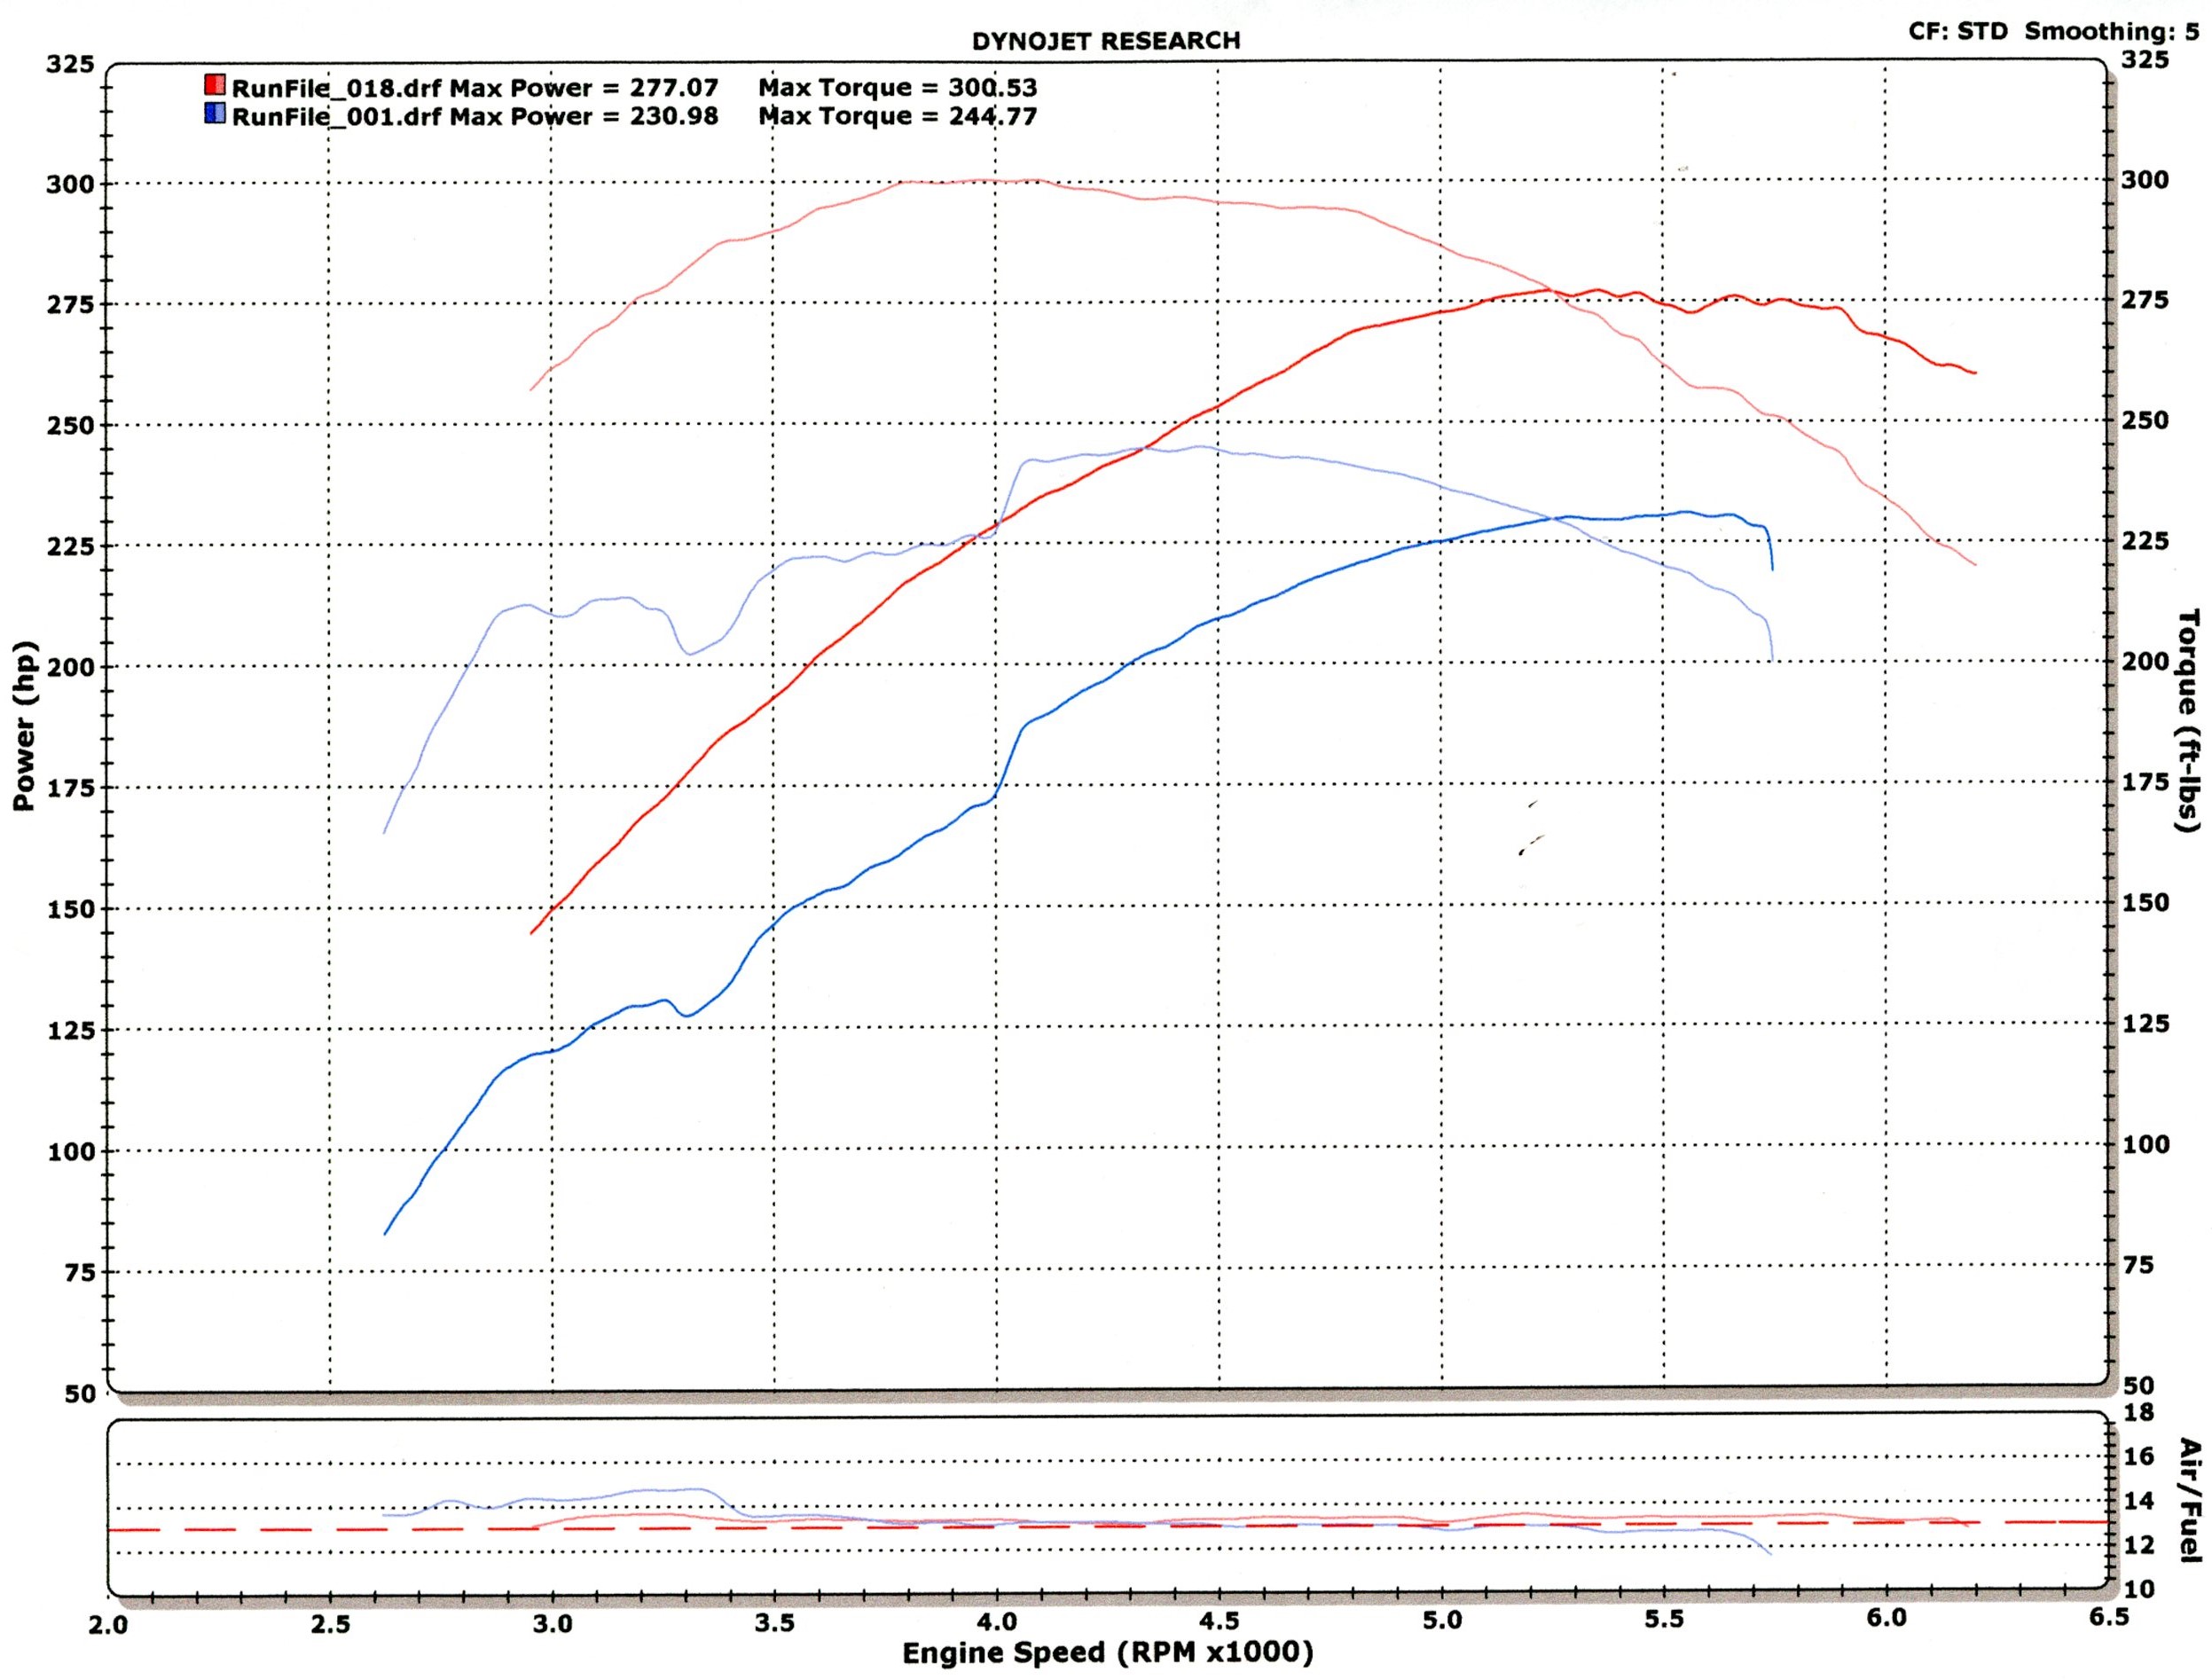
2003 Ford Crown Victoria Dyno Chart - 277 hp / 300 ft-lb vs 231 hp Baseline
Reference · 1998-2011 Crown VictoriaAll 80 data & spec plates
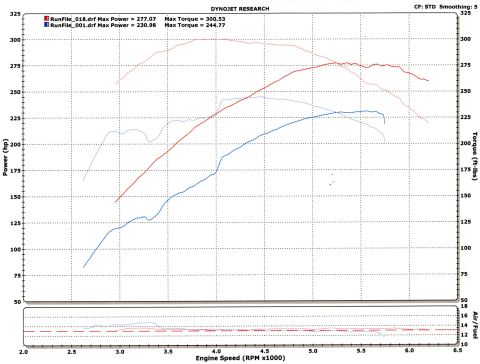
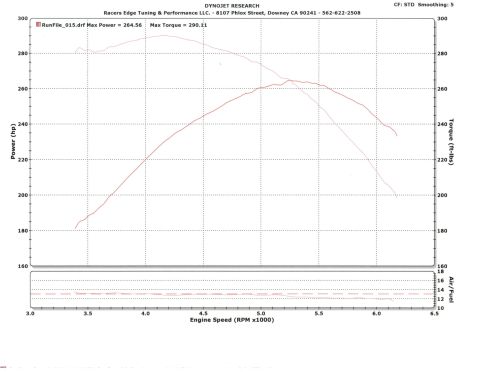
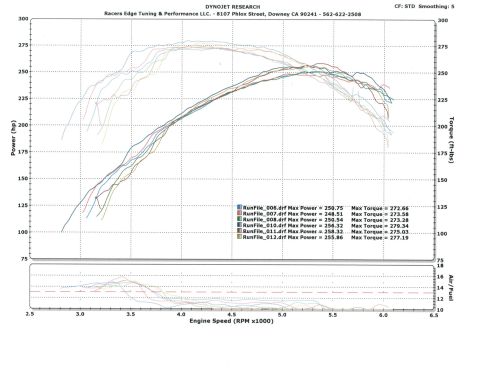
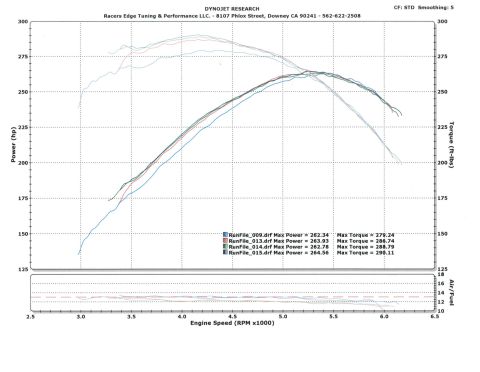
Dynojet before/after dyno chart: modified run 277.07 hp and 300.53 lb-ft versus baseline 230.98 hp and 244.77 lb-ft, a gain of about 46 hp.
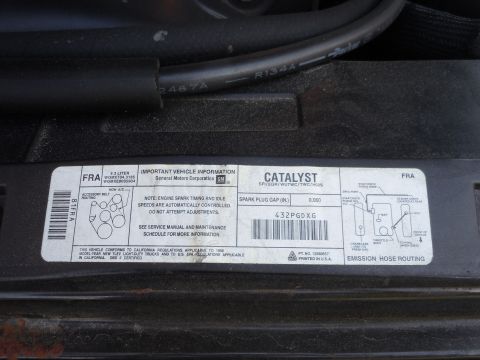
Part of 1998-2011 Ford Crown Victoria Data & Spec Plates
This document is a Dynojet Research chassis dynamometer comparison chart (correction factor STD, smoothing 5) plotting two dyno runs against engine speed from roughly 2,000 to 6,500 RPM. The legend identifies RunFile_018.drf with a maximum power of 277.07 hp and maximum torque of 300.53 ft-lbs (red curves), compared against RunFile_001.drf with a maximum power of 230.98 hp and maximum torque of 244.77 ft-lbs (blue curves). The main plot shows Power (hp) on the left axis and Torque (ft-lbs) on the right axis, both scaled from 50 to 325. The higher run peaks near 300 ft-lbs of torque around 3,800-4,200 RPM and holds roughly 275 hp from about 5,200 RPM through 6,000+ RPM, while the baseline run peaks around 245 ft-lbs and roughly 231 hp near 5,300-5,600 RPM. A lower panel plots Air/Fuel ratio (10-18 scale) for both runs, showing both mixtures generally between about 12.5 and 14.5 across the RPM range. The chart documents a gain of approximately 46 hp and 56 ft-lbs between the two setups. The upload title indicates the same camshafts were used with a different setup on the owner's car, nicknamed "EvilVic."
Is this accurate? Sign in to help verify it.
Frequently asked questions
- What was the max power and torque of the best run on this dyno chart?
- RunFile_018.drf shows Max Power = 277.07 hp and Max Torque = 300.53 ft-lbs.
- What were the baseline run numbers?
- RunFile_001.drf shows Max Power = 230.98 hp and Max Torque = 244.77 ft-lbs.
- How much of a gain does the chart show between the two runs?
- About 46 hp (277.07 vs 230.98) and about 56 ft-lbs of torque (300.53 vs 244.77).
- What dyno and correction factor were used?
- The chart is from Dynojet Research, using CF: STD with Smoothing: 5.
- Does the chart show air/fuel ratio data?
- Yes, a lower panel plots Air/Fuel ratio on a 10-18 scale versus engine speed for both runs, with values generally between about 12 and 15.

No comments yet.