Home/
Registry/
Ford/
Crown Victoria/
1998-2011/
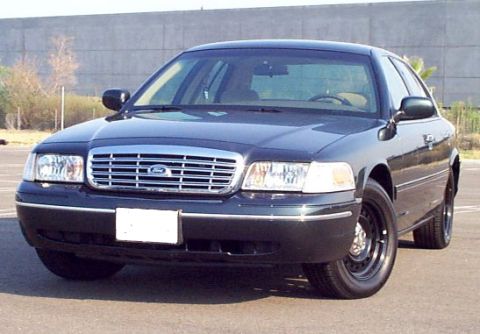
“EVIL VIC”/
Photo
supermotors.net/registry/media/1016032
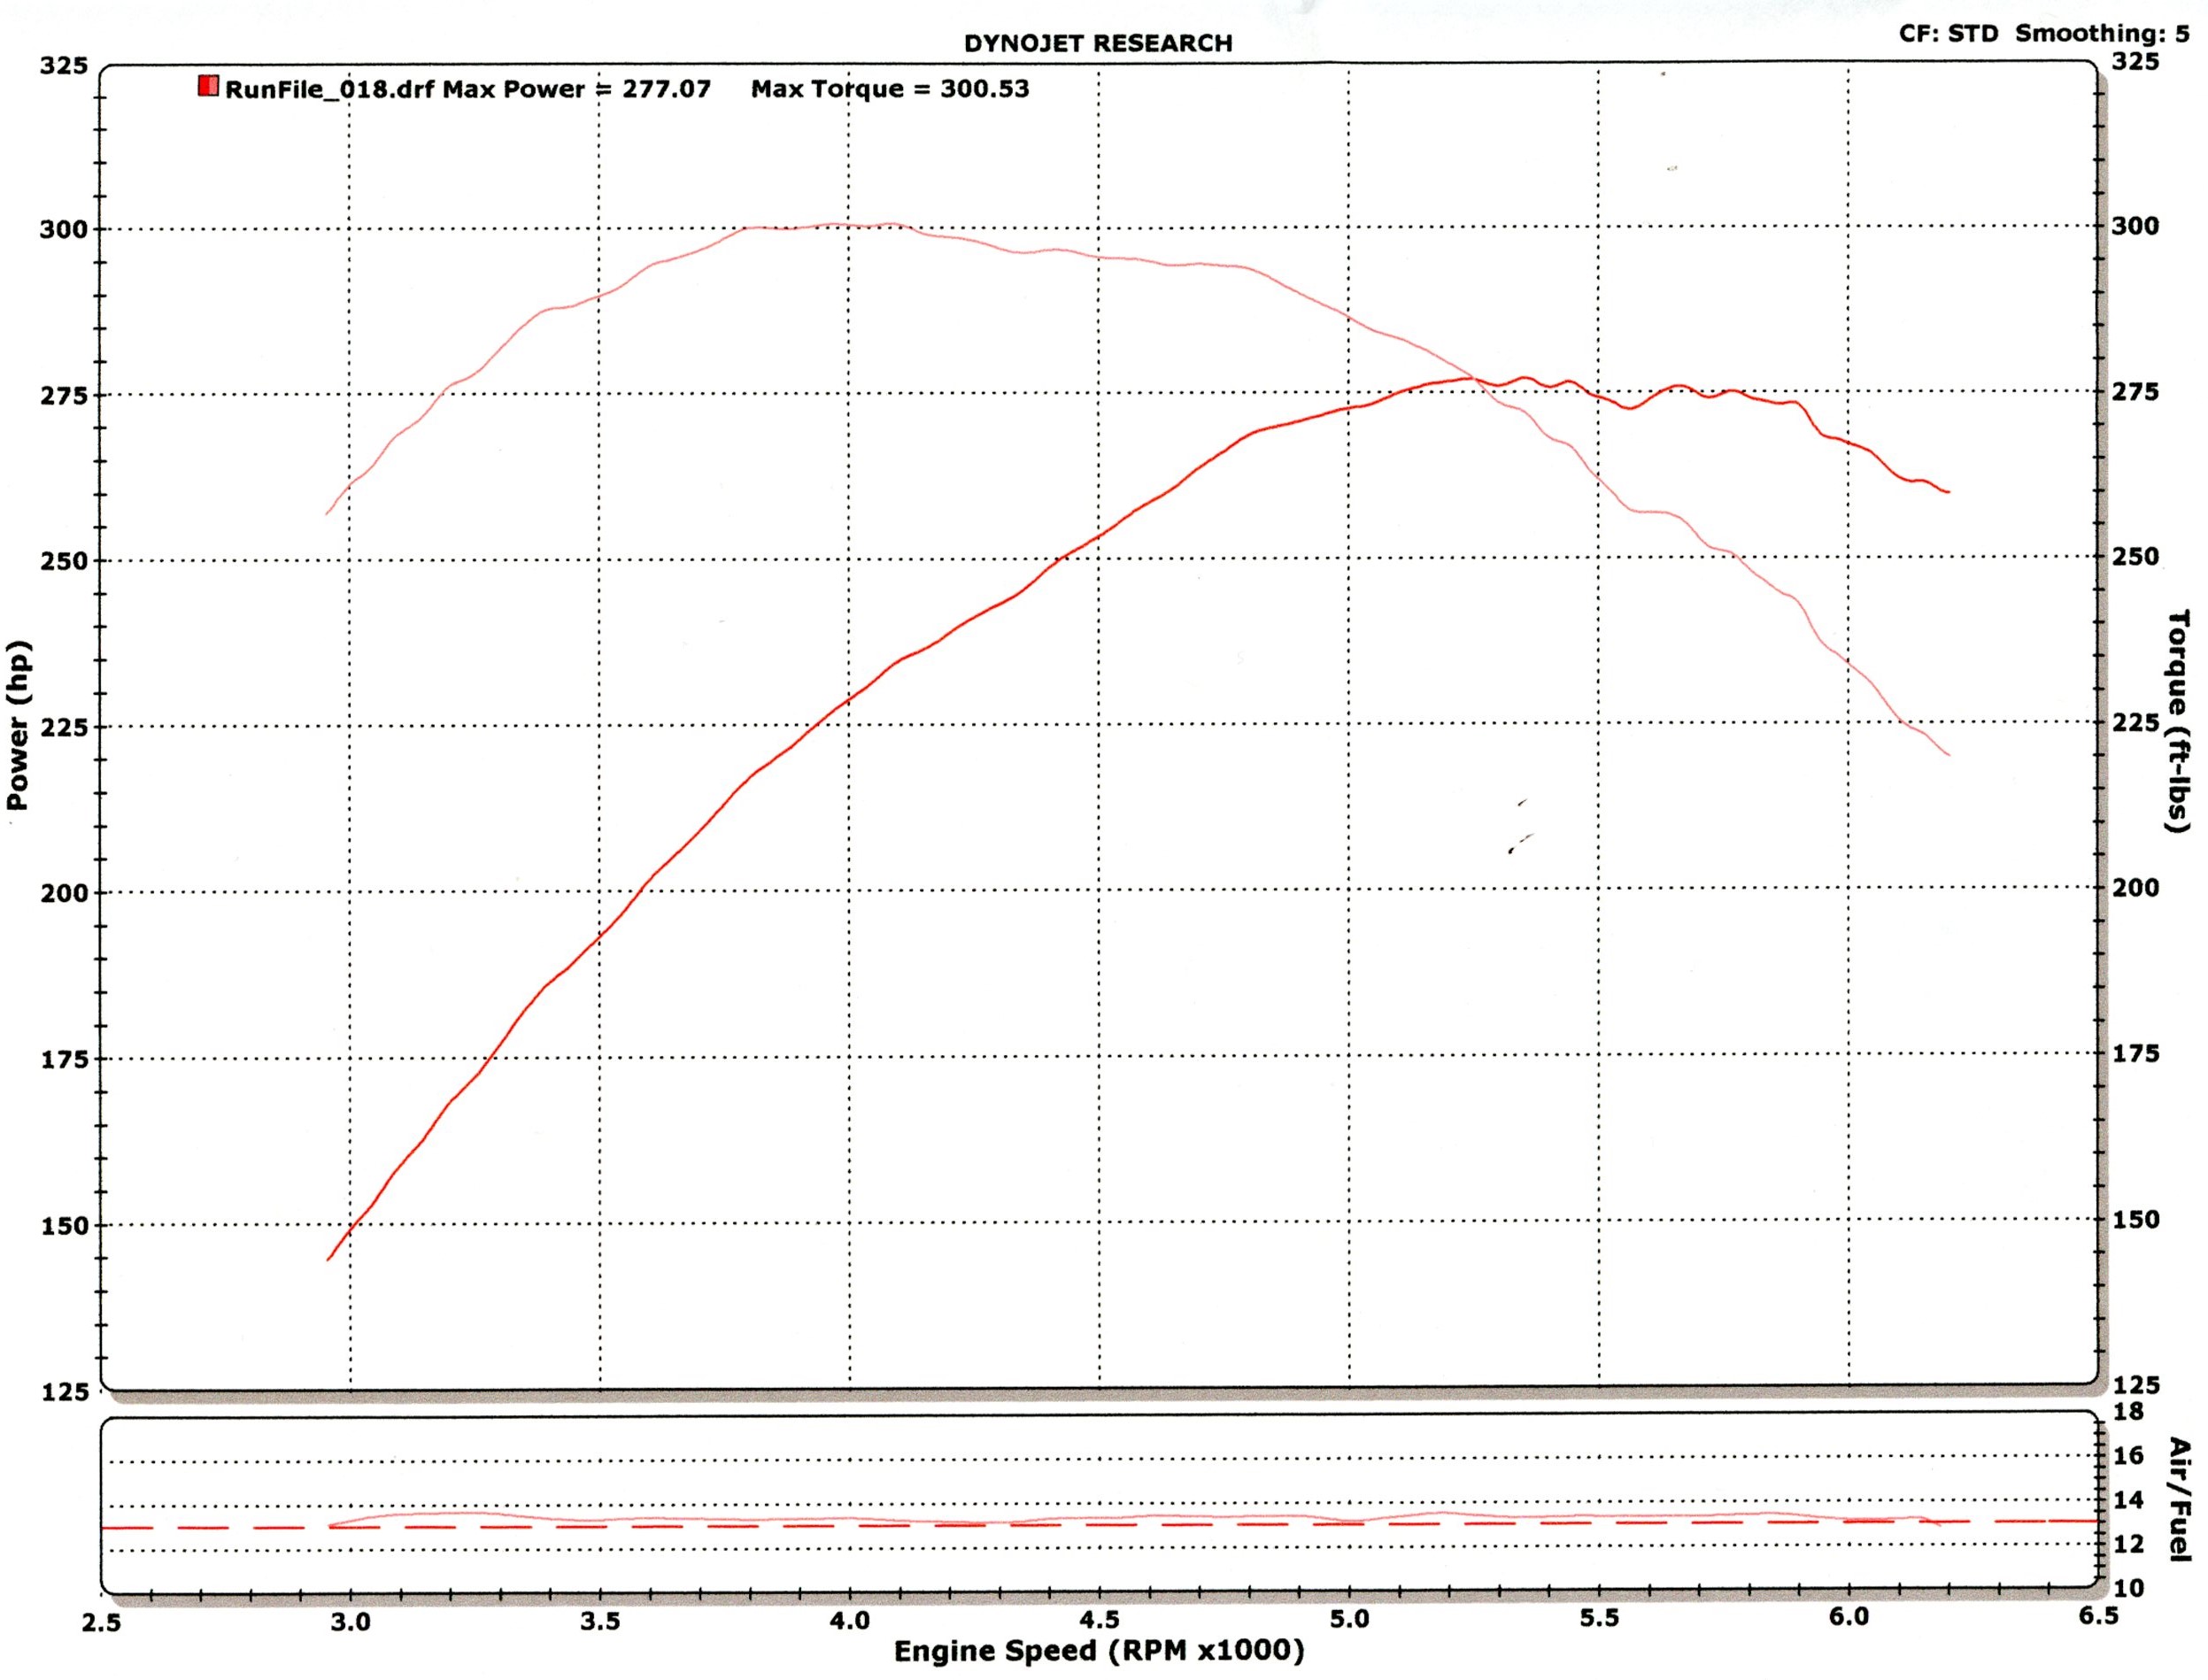
2003 Ford Crown Victoria Dyno Chart - 277 HP / 300 ft-lbs Dynojet Graph
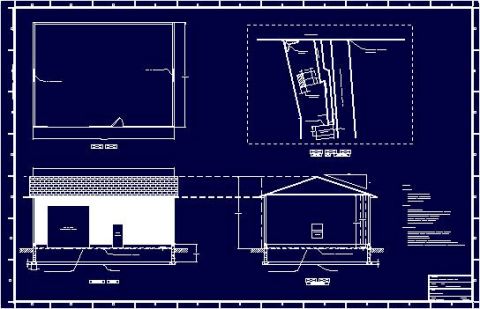
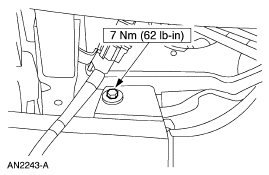
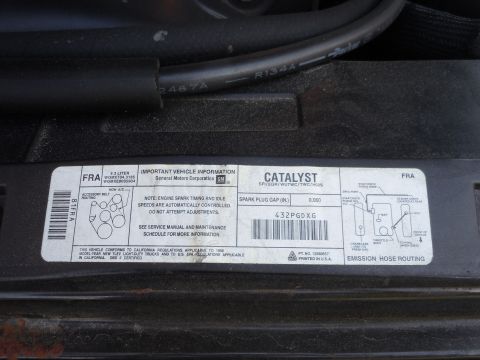
Reference · 1998-2011 Crown VictoriaAll 80 data & spec plates
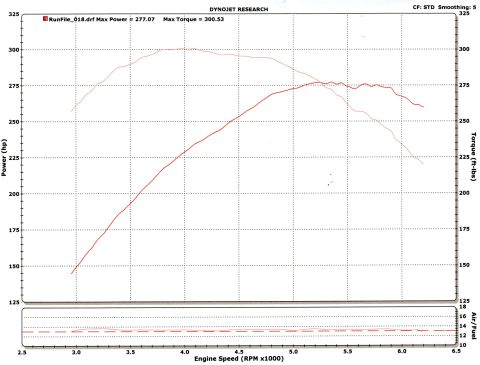
Dynojet dyno graph plotting horsepower and torque against engine RPM, peaking near 277 hp and 300 lb-ft.
Part of 1998-2011 Ford Crown Victoria Data & Spec Plates
This document is a Dynojet Research chassis dynamometer graph (dyno chart) for a single run, file 'RunFile_018.drf', uploaded to the gallery of a 2003 Ford Crown Victoria and labeled 'EVILVIC NEW DYNO'. The chart records a maximum power of 277.07 hp and a maximum torque of 300.53 ft-lbs, with the correction factor noted as STD and smoothing set to 5. The main plot displays two curves against engine speed from roughly 2,900 to about 6,200 RPM: a torque curve (lighter red) that peaks around 300 ft-lbs near 3,800-4,100 RPM and falls off toward roughly 220 ft-lbs by 6,200 RPM, and a power curve (darker red) that climbs steadily from about 145 hp near 3,000 RPM to its ~277 hp peak around 5,200-5,300 RPM, holding near 275 hp before tapering to about 260 hp at redline. A smaller lower plot shows the air/fuel ratio trace, which remains flat at approximately 13:1 across the entire run. A reader can learn the vehicle's measured wheel horsepower and torque, where in the RPM band each peak occurs, and that the fuel mixture stayed consistent throughout the pull.
Is this accurate? Sign in to help verify it.
Frequently asked questions
- What was the maximum power measured on this dyno run?
- Max power was 277.07 hp, as shown in the legend for RunFile_018.drf.
- What was the maximum torque recorded?
- Max torque was 300.53 ft-lbs.
- What correction factor and smoothing were used?
- The chart is labeled CF: STD with Smoothing: 5.
- At approximately what RPM does peak torque occur?
- The torque curve peaks at about 300 ft-lbs around 3,800-4,100 RPM on the graph.
- What does the air/fuel trace show?
- The lower Air/Fuel plot shows the ratio holding roughly flat around 13:1 across the run, on a scale from 10 to 18.

No comments yet.