Home/
Registry/
Ford/
Crown Victoria/
1998-2011/
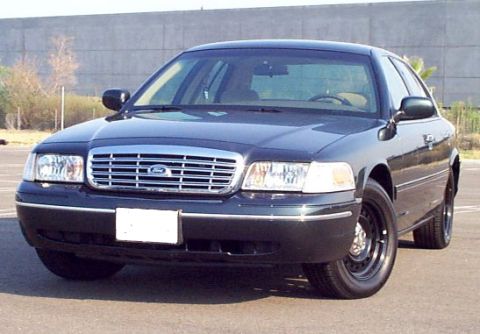
“EVIL VIC”/
Photo
supermotors.net/registry/media/1041708
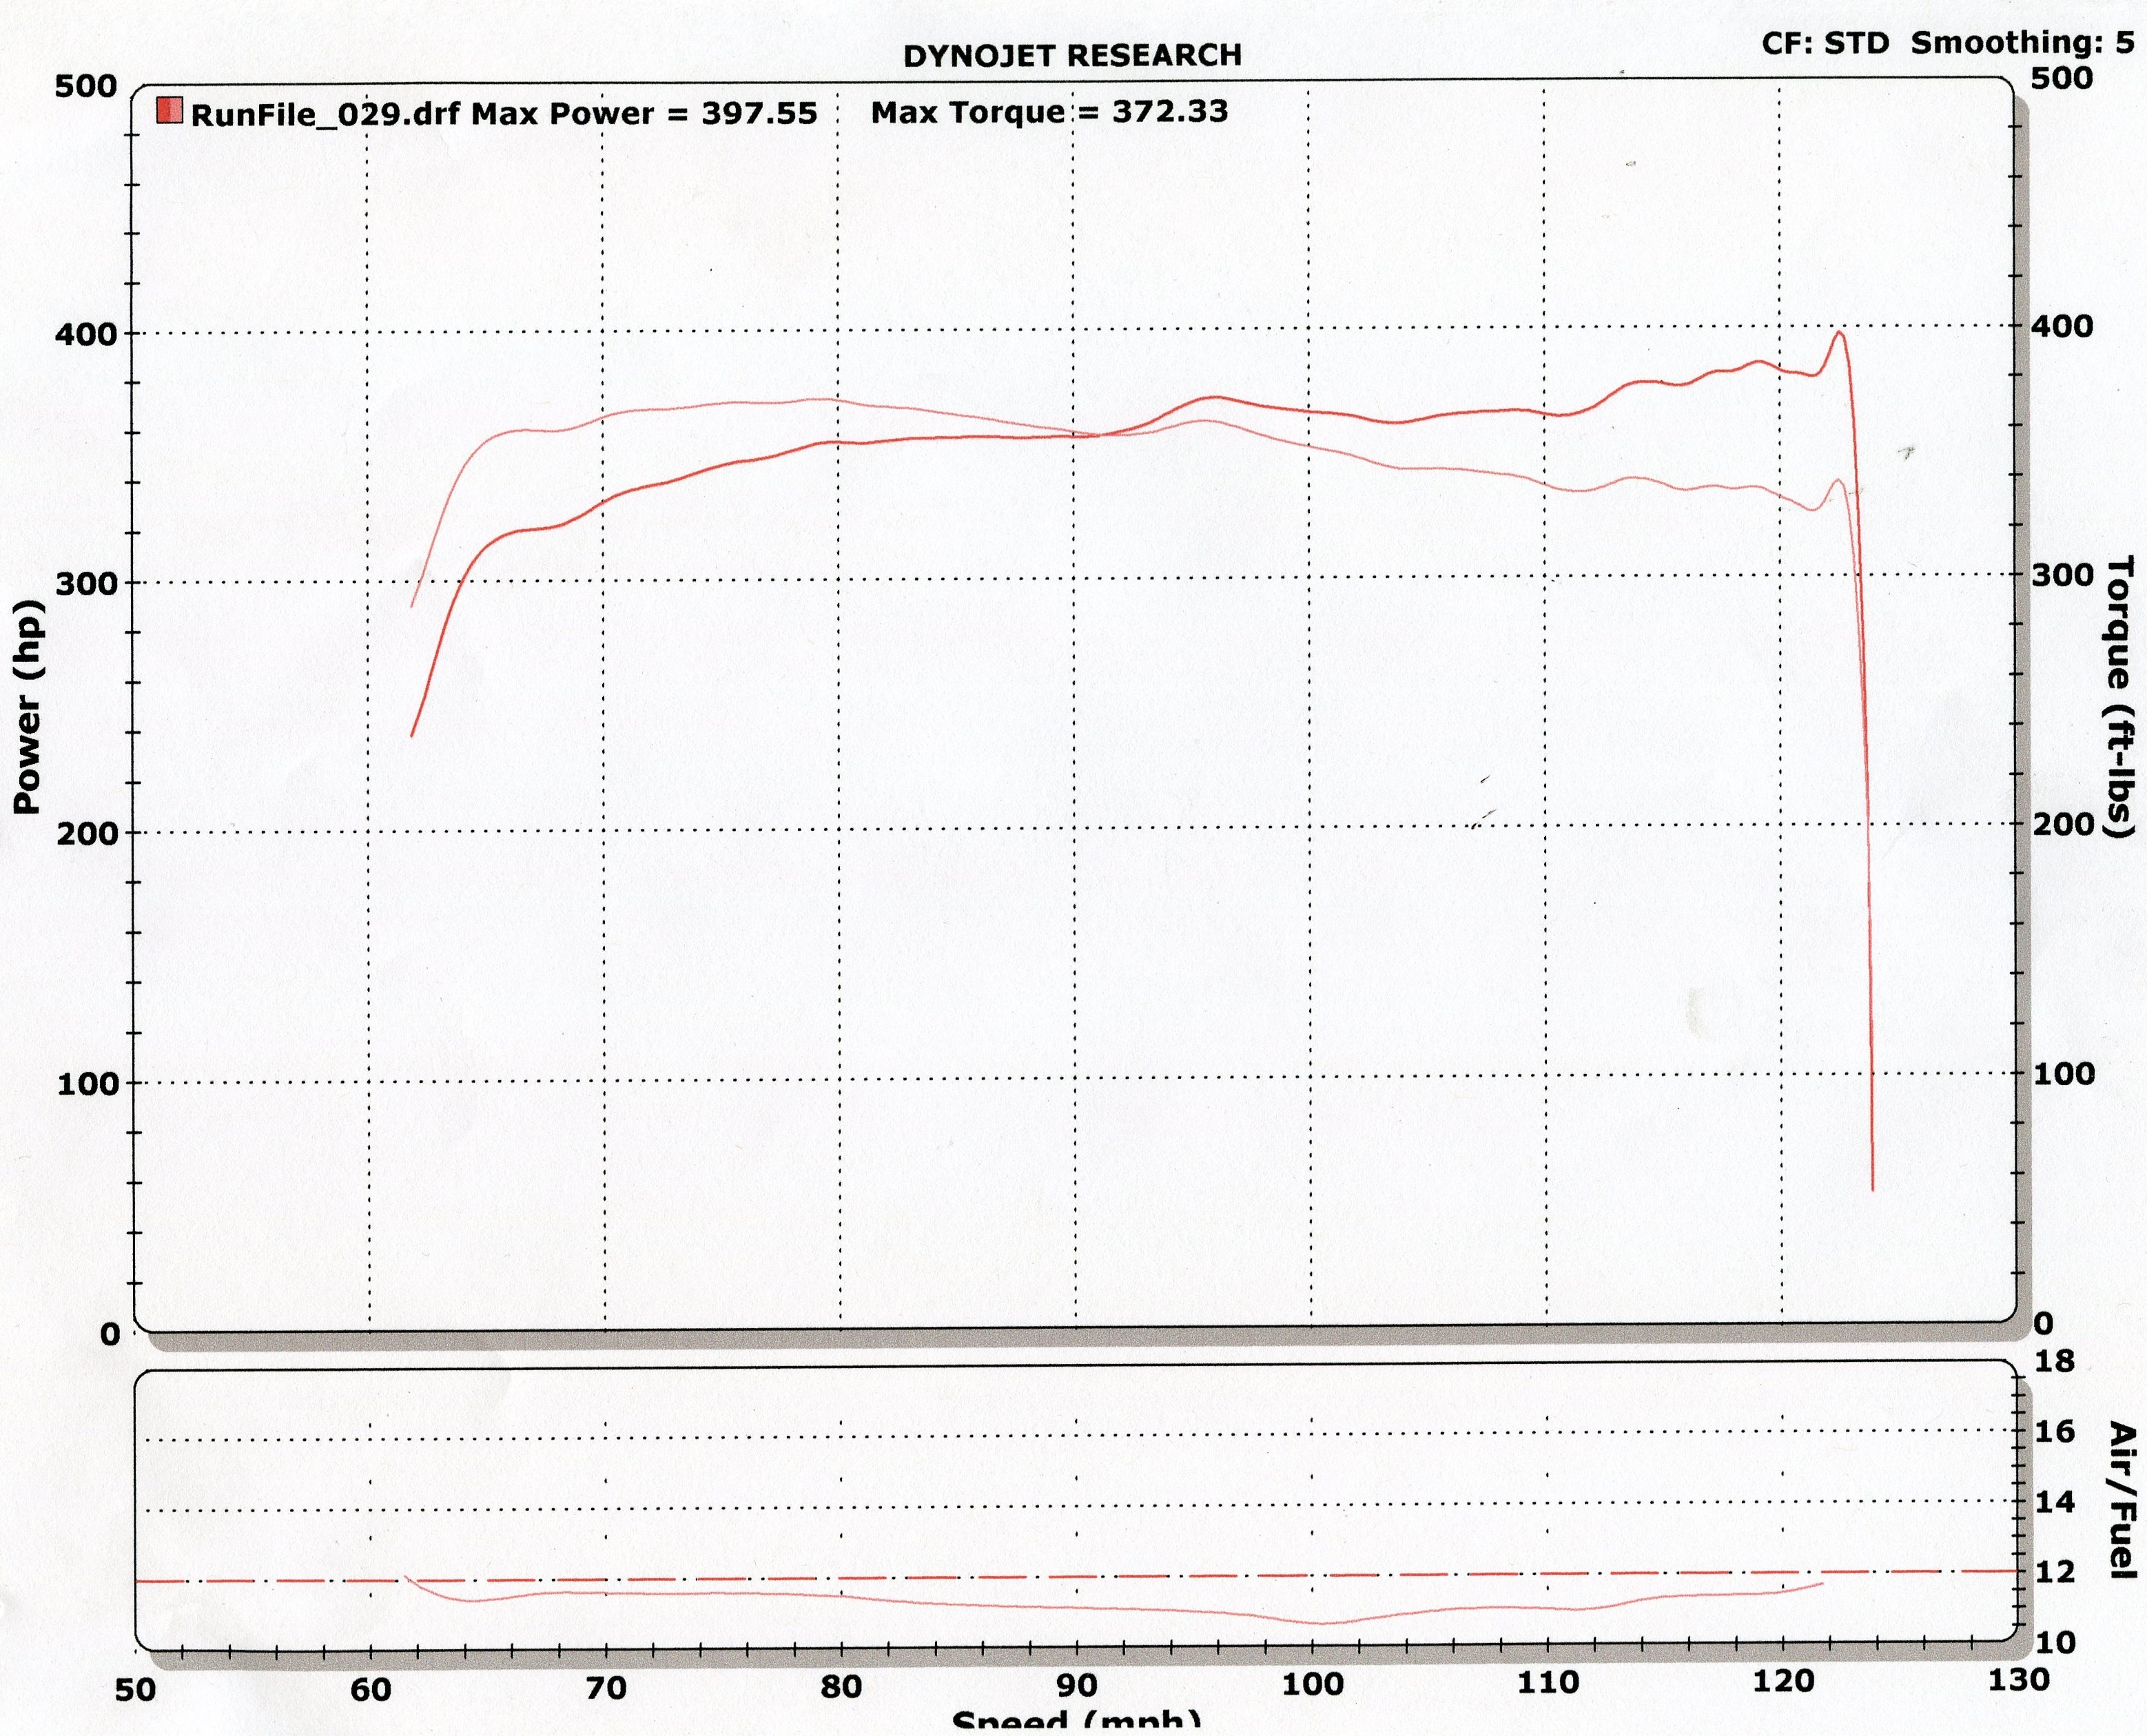
Dynojet Dyno Sheet - 397.55 HP / 372.33 ft-lbs - 2003 Crown Victoria Kenne Bell
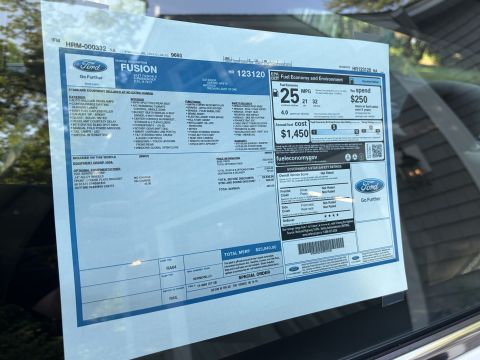
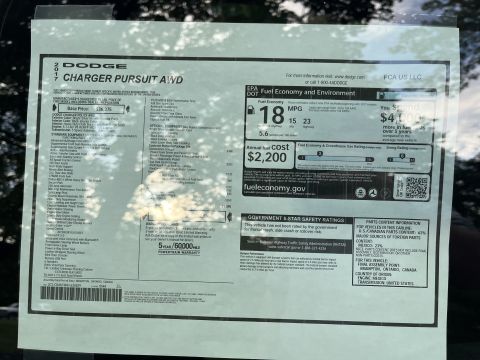
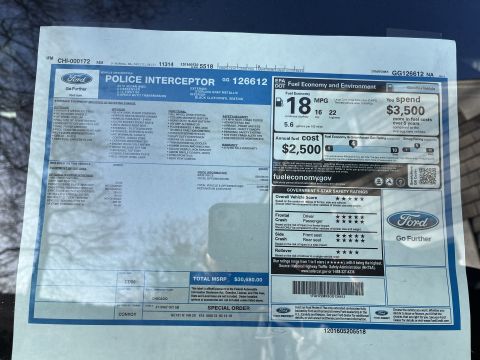
Reference · 1998-2011 Crown VictoriaAll 80 data & spec plates
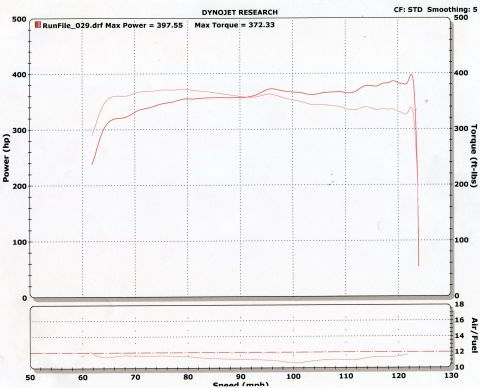
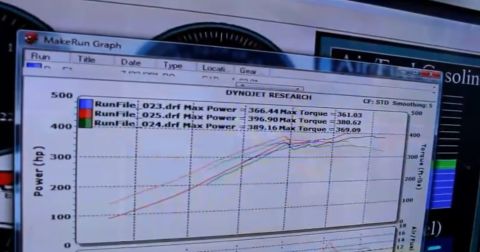
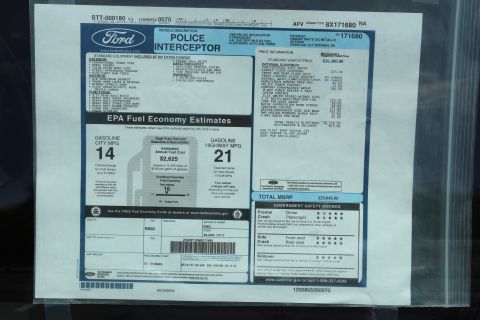
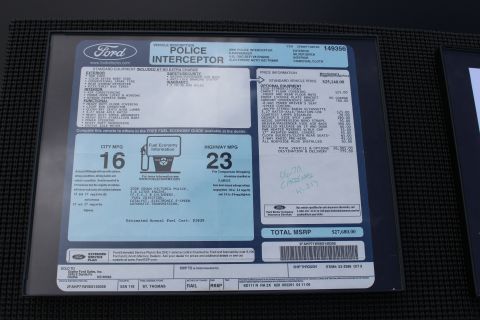
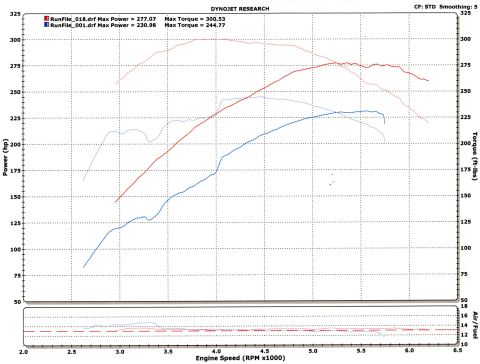
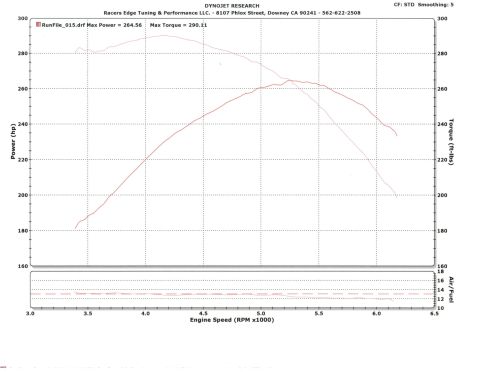
Dynojet Research dyno chart (RunFile_029) plotting power and torque vs speed; peak 397.55 hp and 372.33 lb-ft with a flat ~12.5 air/fuel trace.
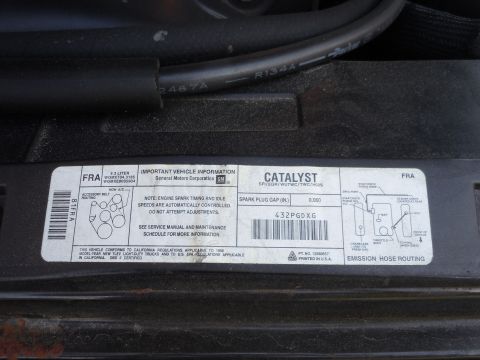
Part of 1998-2011 Ford Crown Victoria Data & Spec Plates
This is a Dynojet Research chassis dynamometer results sheet from a single run (RunFile_029.drf) using standard (STD) correction factor and a smoothing level of 5. The main chart plots Power (hp, left axis, 0-500) and Torque (ft-lbs, right axis, 0-500) against vehicle speed in mph (50-130). The run recorded a maximum power of 397.55 hp and a maximum torque of 372.33 ft-lbs, both measured at the wheels. The power curve (bold red) climbs from roughly 240 hp near 62 mph, rises steadily to the mid-300s by 80 mph, plateaus, and then climbs again above 110 mph to peak near 400 hp at approximately 122 mph before dropping sharply at the end of the run. The torque curve (lighter red) peaks in the low 370s ft-lbs around 78-80 mph and tapers gradually to the mid-340s at high speed. A secondary lower chart shows the Air/Fuel ratio trace (scale 10-18), which stays rich, hovering roughly between 10.5 and 12 throughout the pull, dipping lowest (~10.5) around 100 mph. The document was uploaded as a dyno attempt for a 2003 Ford Crown Victoria with a Kenne Bell supercharger; the sheet itself contains no vehicle identification.
Is this accurate? Sign in to help verify it.
Frequently asked questions
- What was the maximum power recorded on this dyno run?
- Max Power = 397.55 hp, as stated in the legend for RunFile_029.drf.
- What was the maximum torque recorded?
- Max Torque = 372.33 ft-lbs.
- What correction factor and smoothing were used?
- The sheet indicates CF: STD (standard correction factor) with Smoothing: 5.
- What does the air/fuel trace show during the run?
- The A/F trace stays rich, running roughly between about 10.5 and 12:1 across the pull, with the leanest points near 12 at the start and end and the richest (~10.5) around 100 mph.
- Over what speed range was the run measured?
- The X-axis covers 50-130 mph, with the actual run data spanning roughly 62 to about 124 mph.

No comments yet.