Ford 357W GT40 Heads Stock Truck Roller Cam Dyno2000 HP & Torque Curve
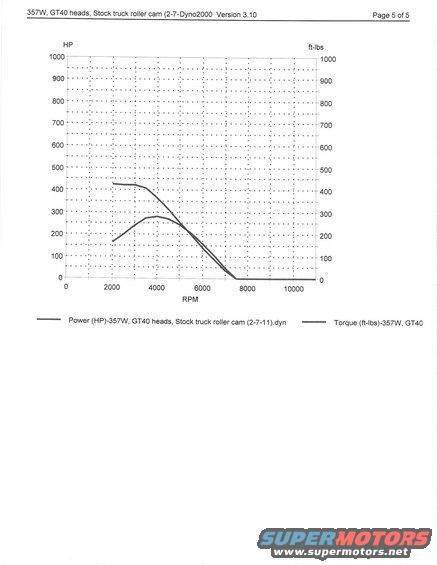
Dyno2000 v3.10 simulation graph (357W, GT40 heads, stock truck roller cam 2-7-11.dyn) plotting HP and torque vs RPM; strong low-end torque ~425 lb-ft, power tapering above 4000 RPM.
This document is page 5 of 5 from a Dyno2000 (Version 3.10) engine simulation report for a 357W (stroked 351 Windsor-based) Ford engine build with GT40 cylinder heads and a stock truck roller camshaft, referenced by the file name '(2-7-11).dyn'. The page contains a single power and torque graph plotting HP (left axis, 0-1000) and torque in ft-lbs (right axis, 0-1000) against engine RPM (0-10,000+). The plotted curves begin around 2000 RPM. Reading the graph, torque starts near 425 ft-lbs at 2000 RPM, holds roughly flat to about 3500 RPM, then declines steadily toward zero around 7500 RPM. The horsepower curve rises from roughly 160 HP at 2000 RPM to a peak of approximately 270-280 HP near 4000 RPM, then falls off, with both curves reaching zero by about 7500 RPM. The legend identifies the two traces as 'Power (HP)-357W, GT40 heads, Stock truck roller cam (2-7-11).dyn' and 'Torque (ft-lbs)-357W, GT40' (remainder cut off). A reader can learn the simulated power band characteristics of this combination: strong low-RPM torque with horsepower peaking around 4000 RPM, typical of a stock truck roller cam profile.
Is this accurate? Sign in to help verify it.
Frequently asked questions
- What engine combination does this dyno graph represent?
- A 357W engine with GT40 heads and a stock truck roller cam, simulated in Dyno2000 Version 3.10 (file '2-7-11.dyn').
- Approximately where does horsepower peak on this graph?
- The power curve peaks at roughly 270-280 HP near 4000 RPM before declining.
- What is the approximate peak torque shown?
- Torque is highest at the start of the curve, roughly 425 ft-lbs around 2000 RPM, staying nearly flat until about 3500 RPM.
- What software produced this chart?
- Dyno2000 Version 3.10, as stated in the page header; this is page 5 of 5 of the report.
- Over what RPM range are the curves plotted?
- The curves start around 2000 RPM and fall to zero by roughly 7500 RPM, on an axis spanning 0 to over 10,000 RPM.
Comments
More from this build
No comments yet.