357W GT40 Heads Comp Cams 2020 Dyno2000 Power & Torque Curve Chart
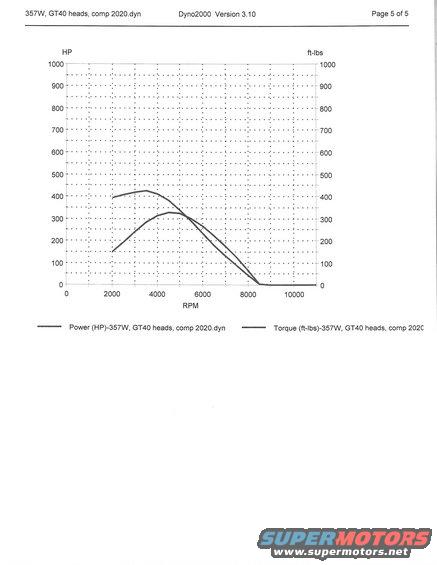
Dyno2000 v3.10 simulation graph (357W, GT40 heads, comp 2020.dyn) plotting HP and torque vs RPM; power peaks near 330 HP around 4500 RPM with torque over 420 lb-ft at low/mid RPM.
This document is page 5 of 5 from a Dyno2000 Version 3.10 engine simulation printout for a 357W (stroked/overbored Ford 351 Windsor-based small-block) fitted with GT40 cylinder heads and a Comp Cams 2020 camshaft (file name "357W, GT40 heads, comp 2020.dyn"). The page contains a single dyno chart plotting Power (HP) on the left axis and Torque (ft-lbs) on the right axis, both scaled 0-1000, against engine RPM from 0 to about 11,000. Reading the curves, torque begins around 395 ft-lbs at 2000 RPM, peaks at roughly 420-425 ft-lbs near 3500 RPM, and tapers off, dropping to zero around 8500 RPM. Horsepower rises from roughly 150 HP at 2000 RPM to a peak of about 320-330 HP in the 4500-5000 RPM range before falling off. A legend below the graph identifies the two traces as Power and Torque for the same simulation file. No numeric data table appears on this page; it is graph-only, complementing other cam-comparison pages in the same album. A reader can learn the simulated power and torque characteristics of this GT40-head/Comp 2020 cam combination across the RPM range.
Is this accurate? Sign in to help verify it.
Frequently asked questions
- What engine combination does this dyno chart represent?
- A 357W engine with GT40 heads and a Comp 2020 cam, per the file name "357W, GT40 heads, comp 2020.dyn" shown in the header and legend.
- What software produced this chart?
- Dyno2000 Version 3.10, as printed in the page header. This is page 5 of 5.
- What is the approximate peak torque shown on the graph?
- The torque curve peaks at roughly 420-425 ft-lbs at around 3500 RPM, starting near 395 ft-lbs at 2000 RPM.
- What is the approximate peak horsepower shown?
- Horsepower peaks at roughly 320-330 HP in the 4500-5000 RPM range before declining.
- Does this page include a data table of HP and torque values?
- No, this page shows only the power and torque curve graph with axis scales and a legend; no numeric table is included.
Comments
More from this build
No comments yet.