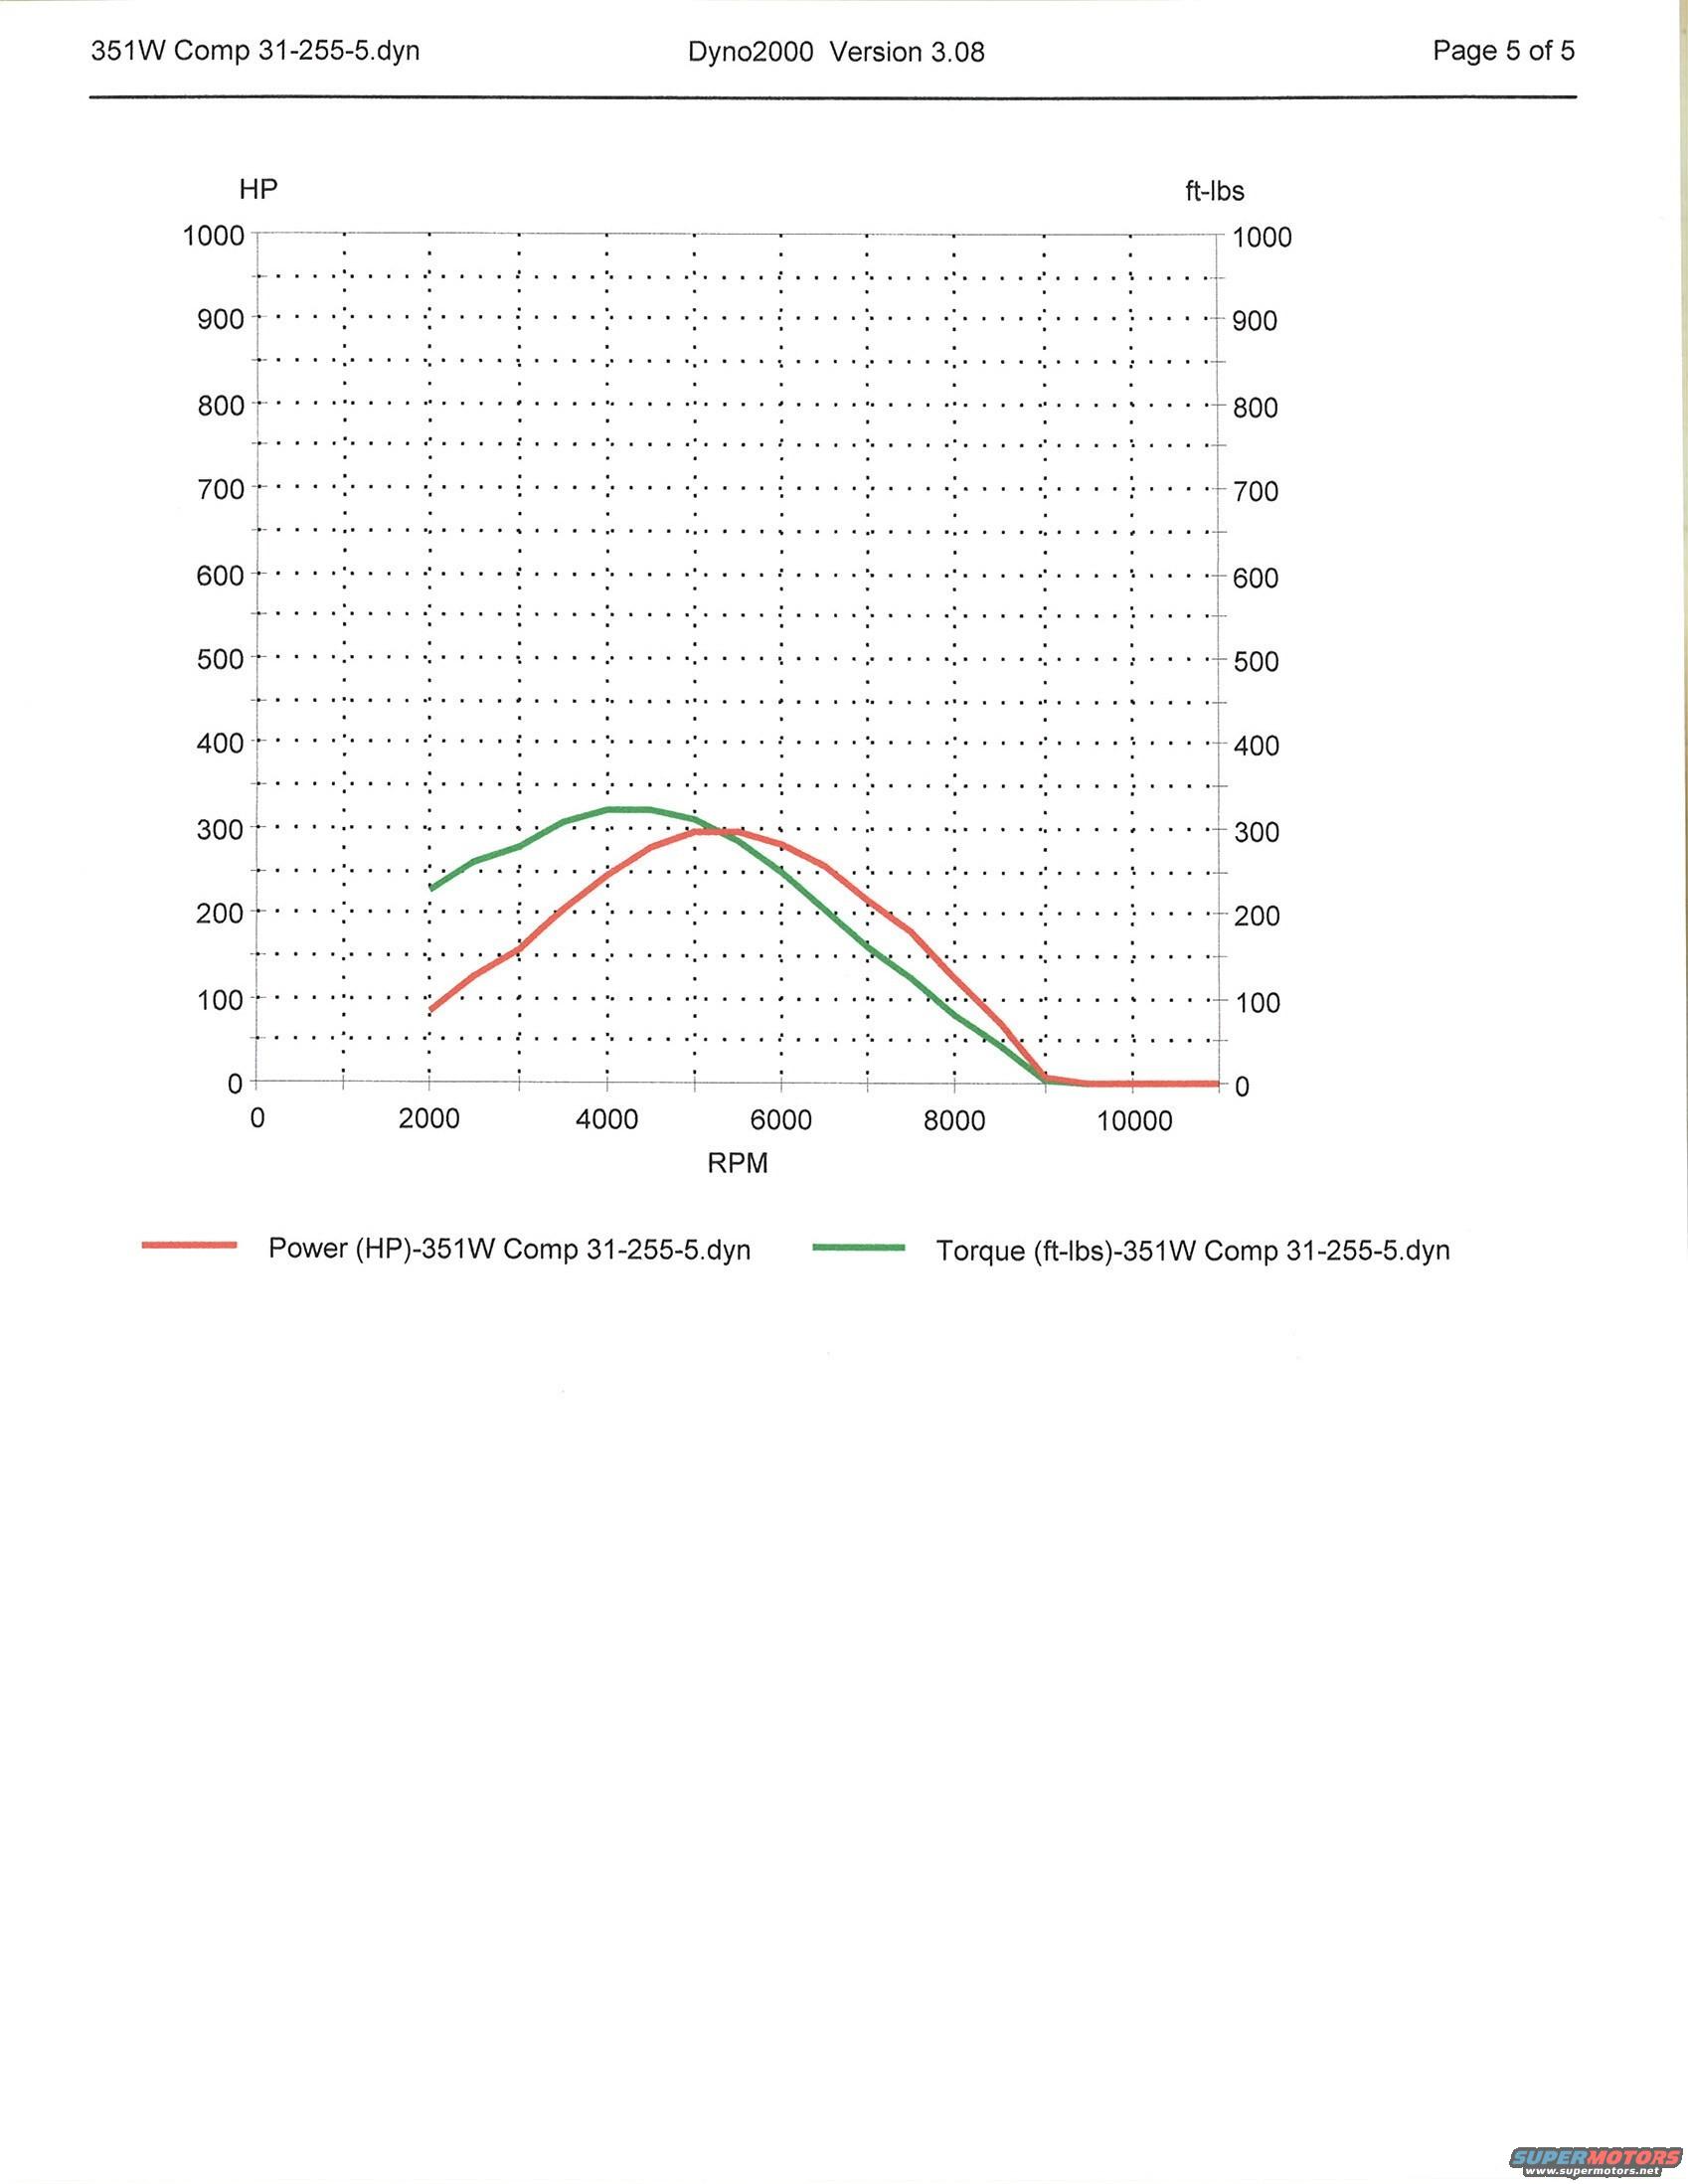
Ford 351W Comp Cams 31-255-5 Flat Tappet Cam Dyno2000 HP & Torque Curve
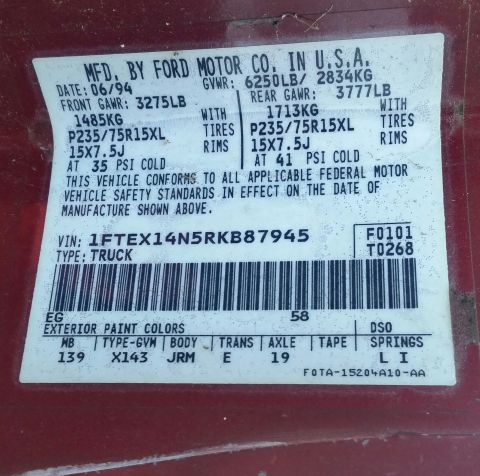
Reference · 1992-1996 F-150All 25 data & spec plates





Dyno2000 v3.08 simulation graph (351W Comp 31-255-5.dyn) plotting horsepower and torque vs RPM, peaking near 300 HP around 5500 RPM and ~322 lb-ft torque, falling off past 8000 RPM.
Part of 1992-1996 Ford F-150 Data & Spec Plates
This document is page 5 of 5 from a Dyno2000 Version 3.08 engine simulation printout for a Ford 351W (Windsor) engine equipped with a Comp Cams 31-255-5 flat tappet camshaft (file name: 351W Comp 31-255-5.dyn). The page consists of a power and torque graph plotted against engine RPM from roughly 2000 to 11000 RPM. Horsepower (red curve) is read on the left axis and torque in ft-lbs (green curve) on the right axis; both axes run from 0 to 1000. From the plotted curves, torque peaks at approximately 320 ft-lbs near 4000-4500 RPM, while horsepower peaks at roughly 295-300 HP around 5000-5500 RPM. Both curves fall off steeply above 6000 RPM and reach essentially zero by about 9000 RPM. No tabular data, part specs, or engine build details appear on this page; it is purely the graphical output of the simulation. Readers can learn the simulated power and torque characteristics of a 351W with this particular Comp Cams flat-tappet grind, useful for comparing against other camshaft options documented in companion pages of the same album.
Is this accurate? Sign in to help verify it.
Frequently asked questions
- What software generated this dyno graph?
- Dyno2000 Version 3.08, using the simulation file '351W Comp 31-255-5.dyn'.
- What engine and camshaft does this graph represent?
- A 351W engine with a Comp 31-255-5 camshaft, per the file name '351W Comp 31-255-5.dyn' shown in the header and legend.
- What is the approximate peak horsepower shown on the graph?
- The red power curve peaks at roughly 295-300 HP around 5000-5500 RPM.
- What is the approximate peak torque shown?
- The green torque curve peaks at approximately 320 ft-lbs around 4000-4500 RPM.
- What RPM range does the graph cover?
- The X-axis spans 0 to about 11000 RPM, with the plotted curves starting near 2000 RPM and falling to essentially zero by about 9000 RPM.

No comments yet.