357W GT40 Heads Isky Cam 371257-265 Dyno2000 HP & Torque Curve Graph
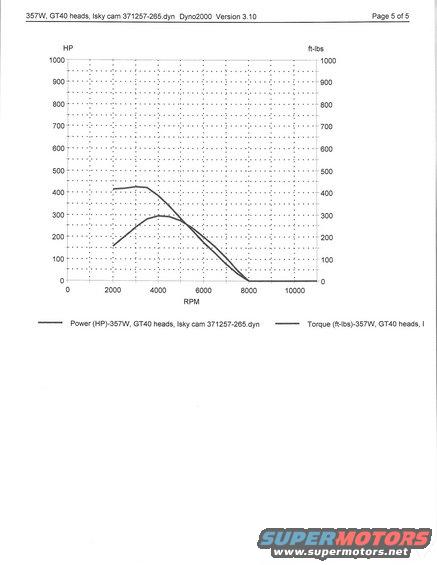
Dyno2000 v3.10 simulation graph (357W, GT40 heads, Isky cam 371257-265.dyn) page 5 of 5 plotting horsepower and torque vs RPM from 2000 to 10000 RPM.
This document is page 5 of 5 from a Dyno2000 Version 3.10 computer engine simulation printout for a 357W (stroked/bored 351 Windsor) engine build using Ford GT40 cylinder heads and an Isky camshaft, part number 371257-265 (simulation file '371257-265.dyn'). The page consists of a single dyno graph plotting simulated Power (HP, left axis) and Torque (ft-lbs, right axis) against engine RPM from 0 to over 10,000 RPM, with both vertical axes scaled 0-1000. The plotted data spans roughly 2000-8000 RPM. Torque begins around 415 ft-lbs at 2000 RPM, peaks at approximately 425 ft-lbs around 3000-3500 RPM, and falls off toward zero near 8000 RPM. Horsepower peaks at roughly 295 HP around 4000-4500 RPM. A reader can learn the general power and torque characteristics of this simulated 357W/GT40/Isky cam combination: a low-RPM, torque-oriented build with strong torque from just off idle and horsepower peaking in the mid-4000 RPM range. The legend identifies both curves; the torque legend text is truncated at the page edge. This is one page of a larger multi-page dyno report set comparing various camshafts in the same engine.
Is this accurate? Sign in to help verify it.
Frequently asked questions
- What engine combination does this dyno graph represent?
- A 357W engine with GT40 heads and an Isky cam 371257-265, simulated in Dyno2000 Version 3.10 (file 371257-265.dyn).
- What is the approximate peak torque shown on the graph?
- Peak torque is roughly 420-425 ft-lbs, occurring around 3000-3500 RPM.
- What is the approximate peak horsepower and at what RPM?
- Peak horsepower is approximately 295 HP, occurring around 4000-4500 RPM.
- What software generated this dyno curve?
- Dyno2000, Version 3.10; this is page 5 of 5 of the printout.
- Over what RPM range are the curves plotted?
- The power and torque curves are plotted from about 2000 RPM up to approximately 8000 RPM, where both fall to near zero.
Comments
More from this build
No comments yet.