Home/
Registry/
Ford/
Probe/
1993-1997/
1996 Ford Probe/
Photo
supermotors.net/registry/media/313183
1996 Ford Probe Dynojet Dyno Chart - 189 hp / 165 ft-lb Dyno Run Results

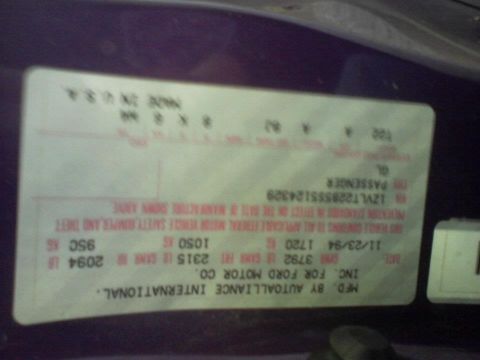
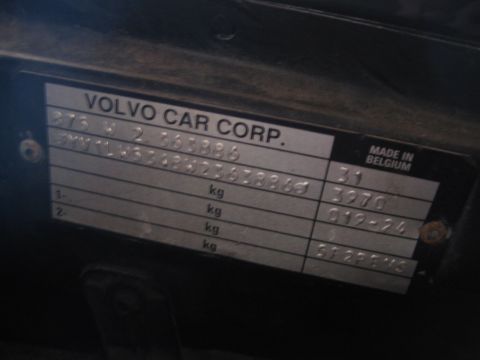
Reference · 1993-1997 ProbeAll 16 data & spec plates
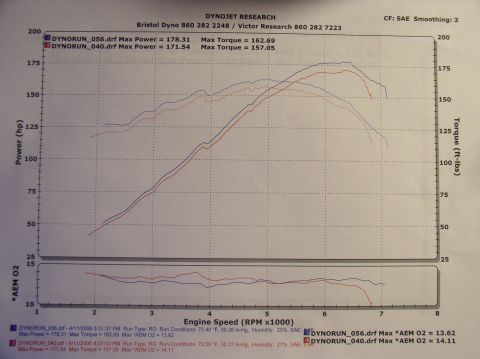
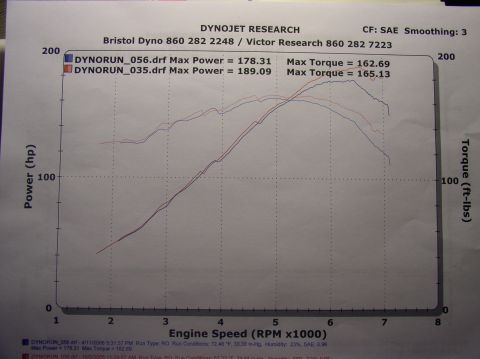
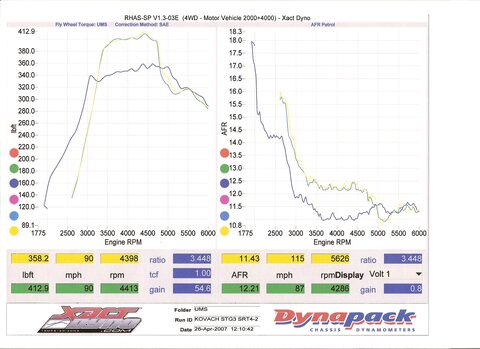
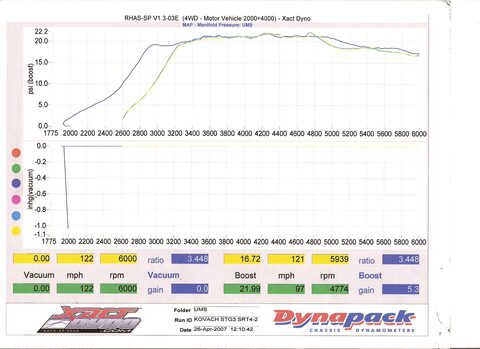
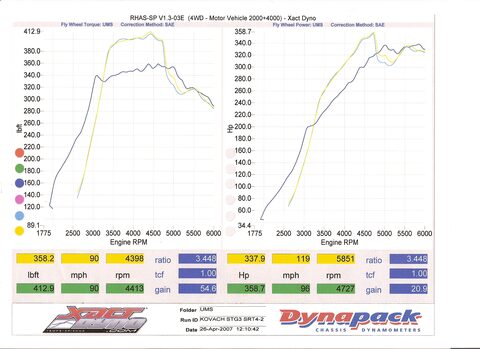
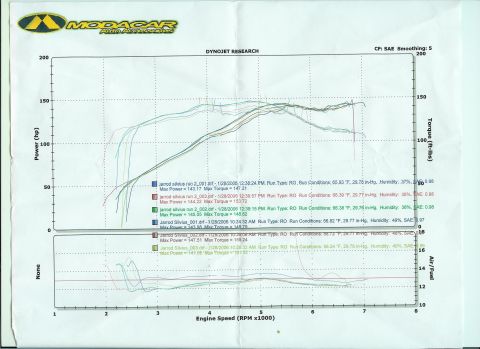
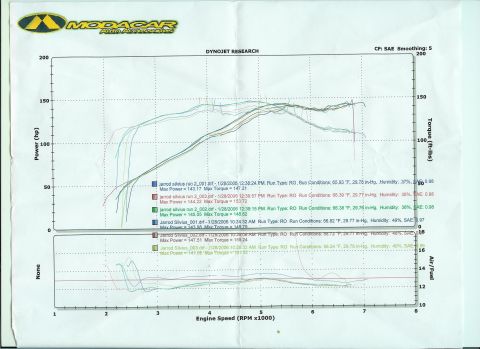

DynoJet Research SAE power/torque chart (Bristol Dyno) overlaying two runs: DYNORUN_056 at 178.31 hp / 162.69 lb-ft and DYNORUN_035 at 189.09 hp / 165.13 lb-ft.
Part of 1993-1997 Ford Probe Data & Spec Plates
This document is a photographed printout of a Dynojet Research chassis dynamometer graph produced at Bristol Dyno (860 282 2248) / Victor Research (860 282 7223), comparing two dyno runs of the same vehicle. The chart plots Power (hp) on the left axis and Torque (ft-lbs) on the right axis against Engine Speed (RPM x1000, roughly 1-8), using SAE correction factor with smoothing level 3. The blue trace, DYNORUN_056.drf recorded 4/11/2006 at 5:31:37 PM (run conditions 72.48 °F, 30.38 in-Hg, 23% humidity, SAE correction 0.96), shows a maximum power of 178.31 hp and maximum torque of 162.69 ft-lbs. The red trace, DYNORUN_035.drf recorded 10/9/2005 at 11:24:57 AM (67.33 °F, 29.94 in-Hg, 58% humidity, SAE correction 0.98), shows a maximum power of 189.09 hp and maximum torque of 165.13 ft-lbs. Power on both runs peaks around 6,000-6,500 RPM and torque peaks in the mid-4,000 to 5,000 RPM range. The reader can learn the vehicle's measured wheel horsepower and torque on two dates and compare the change (a loss of roughly 10.8 hp between the 2005 and 2006 runs). Uploaded to a 1996 Ford Probe gallery; the printout itself does not identify the vehicle.
Is this accurate? Sign in to help verify it.
Frequently asked questions
- What were the peak power and torque numbers on this dyno sheet?
- DYNORUN_035 (red, 10/9/2005) recorded a max power of 189.09 hp and max torque of 165.13 ft-lbs. DYNORUN_056 (blue, 4/11/2006) recorded a max power of 178.31 hp and max torque of 162.69 ft-lbs.
- What correction factor and smoothing were used for these dyno runs?
- The chart states CF: SAE with Smoothing: 3. The individual SAE correction values were 0.96 for DYNORUN_056 and 0.98 for DYNORUN_035.
- Where were these dyno runs performed?
- The header reads 'Bristol Dyno 860 282 2248 / Victor Research 860 282 7223' on a Dynojet Research dynamometer.
- What were the atmospheric conditions during each run?
- DYNORUN_056 (4/11/2006): 72.48 °F, 30.38 in-Hg, 23% humidity. DYNORUN_035 (10/9/2005): 67.33 °F, 29.94 in-Hg, 58% humidity.
- At roughly what RPM does power peak on this chart?
- Both power curves peak at approximately 6,000-6,500 RPM on the Engine Speed (RPM x1000) axis, with the runs ending near 7,000 RPM.
No comments yet.