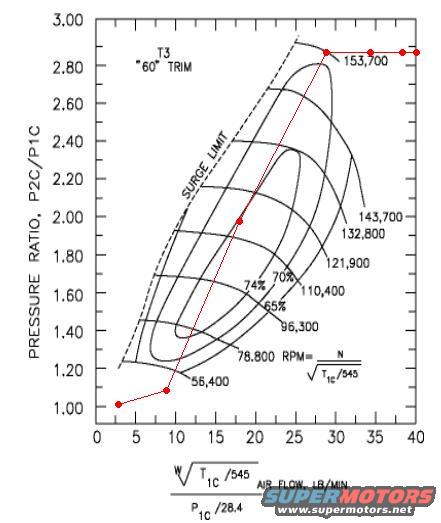
Garrett T3 60 Trim Turbo Compressor Map with Plotted Operating Line
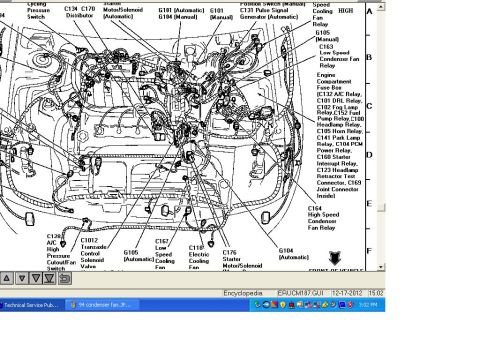
Reference · 1993-1997 ProbeAll 25 schematics
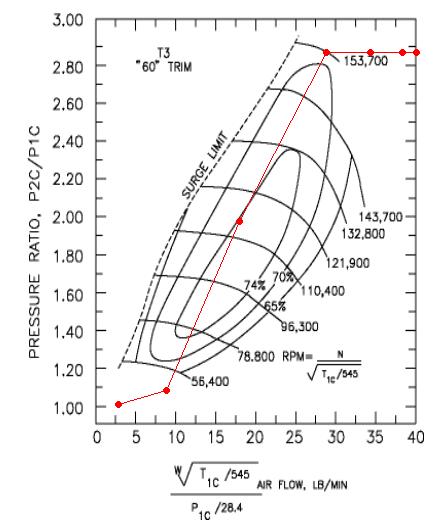

Garrett T3 60-trim turbocharger compressor map plotting pressure ratio against corrected mass air flow with efficiency islands and an overlaid operating line.
Part of 1993-1997 Ford Probe Schematics
This document is a compressor map for a Garrett T3 turbocharger with a "60" trim compressor wheel. The map plots pressure ratio (P2C/P1C, from 1.00 to 3.00) on the vertical axis against corrected air flow (W√(T1C/545)/(P1C/28.4), in lb/min, from 0 to 40) on the horizontal axis. A dashed line on the left marks the surge limit. Constant-speed lines are labeled with corrected shaft speeds of 56,400; 78,800; 96,300; 110,400; 121,900; 132,800; 143,700; and 153,700 RPM, with the formula RPM = N/√(T1C/545) noted. Efficiency islands are marked at 74%, 70%, and 65%, with the peak efficiency region near the map center. A red operating line has been drawn onto the map by the uploader, showing a plotted current setup: starting near 3 lb/min at a pressure ratio of 1.00, rising through roughly 9 lb/min at 1.09 and 18 lb/min at about 1.98, reaching approximately 2.87 pressure ratio at 28 lb/min, then extending flat at that pressure ratio out to 40 lb/min. A reader can determine where this operating line falls relative to the surge limit, efficiency islands, and turbo speed lines. The map itself is not vehicle-specific; it was filed under a 1993 Ford Probe.
Is this accurate? Sign in to help verify it.
Frequently asked questions
- What turbocharger does this compressor map cover?
- It is labeled "T3, '60' TRIM," i.e., a T3 turbo with a 60 trim compressor wheel.
- What is the peak compressor efficiency shown on this map?
- The innermost efficiency island shown is 74%, with additional islands at 70% and 65%.
- What turbo shaft speeds are shown on the map?
- Corrected speed lines of 56,400; 78,800; 96,300; 110,400; 121,900; 132,800; and 143,700 RPM, with a maximum line of 153,700 RPM (RPM = N/√(T1C/545)).
- What are the map's axis ranges?
- Pressure ratio (P2C/P1C) from 1.00 to 3.00 on the vertical axis, and corrected airflow from 0 to 40 lb/min on the horizontal axis.
- What does the red line on the map show?
- A plotted operating line rising from about 3 lb/min at a 1.00 pressure ratio to roughly 2.87 pressure ratio near 28 lb/min, then running flat at ~2.87 out to 40 lb/min.


No comments yet.